
A familiar shape appears on your trade chart. The neckline, flag, triangle, or reversal candle seems clean. You enter, price moves a few points in your favor, and then the setup falls apart.
That does not make chart analysis useless. More often, the shape was asked to do more work than it could. A pattern describes how price has moved. It does not explain the market regime, guarantee that other traders see the same boundary, or tell you whether the potential reward can survive the spread, slippage, and a sensible stop.
The practical fix is not to memorize more formations. It is to become stricter about context, confirmation, invalidation, and execution.

What a Trade Chart Can—and Cannot—Tell You
A trade chart organizes past prices by time. Depending on the platform, it may also show volume, indicators, spreads, orders, and news markers. That makes it useful for identifying trend, volatility, repeated reaction zones, and changes in momentum.
But a chart is not a forecast engine. The same triangle can be accumulation, distribution, or ordinary two-way trade. A long lower wick can show rejection, but it can also be the temporary result of thin liquidity. A moving-average cross can confirm that a move has already happened without offering an attractive new entry.
Treat every pattern as a hypothesis:
Context: Where is the setup forming?
Trigger: What price behavior confirms it?
Invalidation: What evidence proves the idea wrong?
Risk: How much can be lost if the hypothesis fails?
Execution: Can the trade be entered and exited at realistic prices?
If one of those pieces is missing, the setup is incomplete even when the drawing looks perfect.
Six Context Checks Before You Name the Pattern
1. Market regime
First decide whether price is trending, ranging, or moving erratically around an event. Continuation patterns need an established directional move. Range strategies need stable boundaries. A setup designed for orderly conditions can fail repeatedly when volatility expands.
2. Location
Patterns matter more at meaningful locations than in the middle of noise. Check prior swing highs and lows, range edges, weekly or daily reaction areas, and obvious liquidity zones. A bearish reversal formation directly above strong support has less room to work than the same formation after an extended rise into resistance.
3. Higher-timeframe structure
A five-minute sell signal may be only a pullback inside a daily uptrend. That does not make the lower-timeframe setup invalid, but it changes the expected distance, duration, and risk. Define the higher-timeframe condition before using the lower timeframe to time the entry.
4. Volatility
The distance between entry, invalidation, and target should reflect current movement. A fixed ten-pip stop may be generous in a quiet period and meaningless during a volatile session. Compare the proposed stop with recent candle ranges and normal movement for the pair and session.
5. Timing and liquidity
A pattern completed during an active overlap of major sessions may behave differently from one printed in thin liquidity. Spreads can widen around session changes and major announcements. A visually valid entry may not be economically attractive once the actual bid and ask are considered.
6. Event risk
Scheduled central-bank decisions, inflation data, employment reports, and unexpected headlines can overwhelm nearby chart levels. Technical structure can still help organize risk, but it cannot remove gap, slippage, or rapid repricing risk.
Seven Trade Chart Patterns Traders Commonly Misread
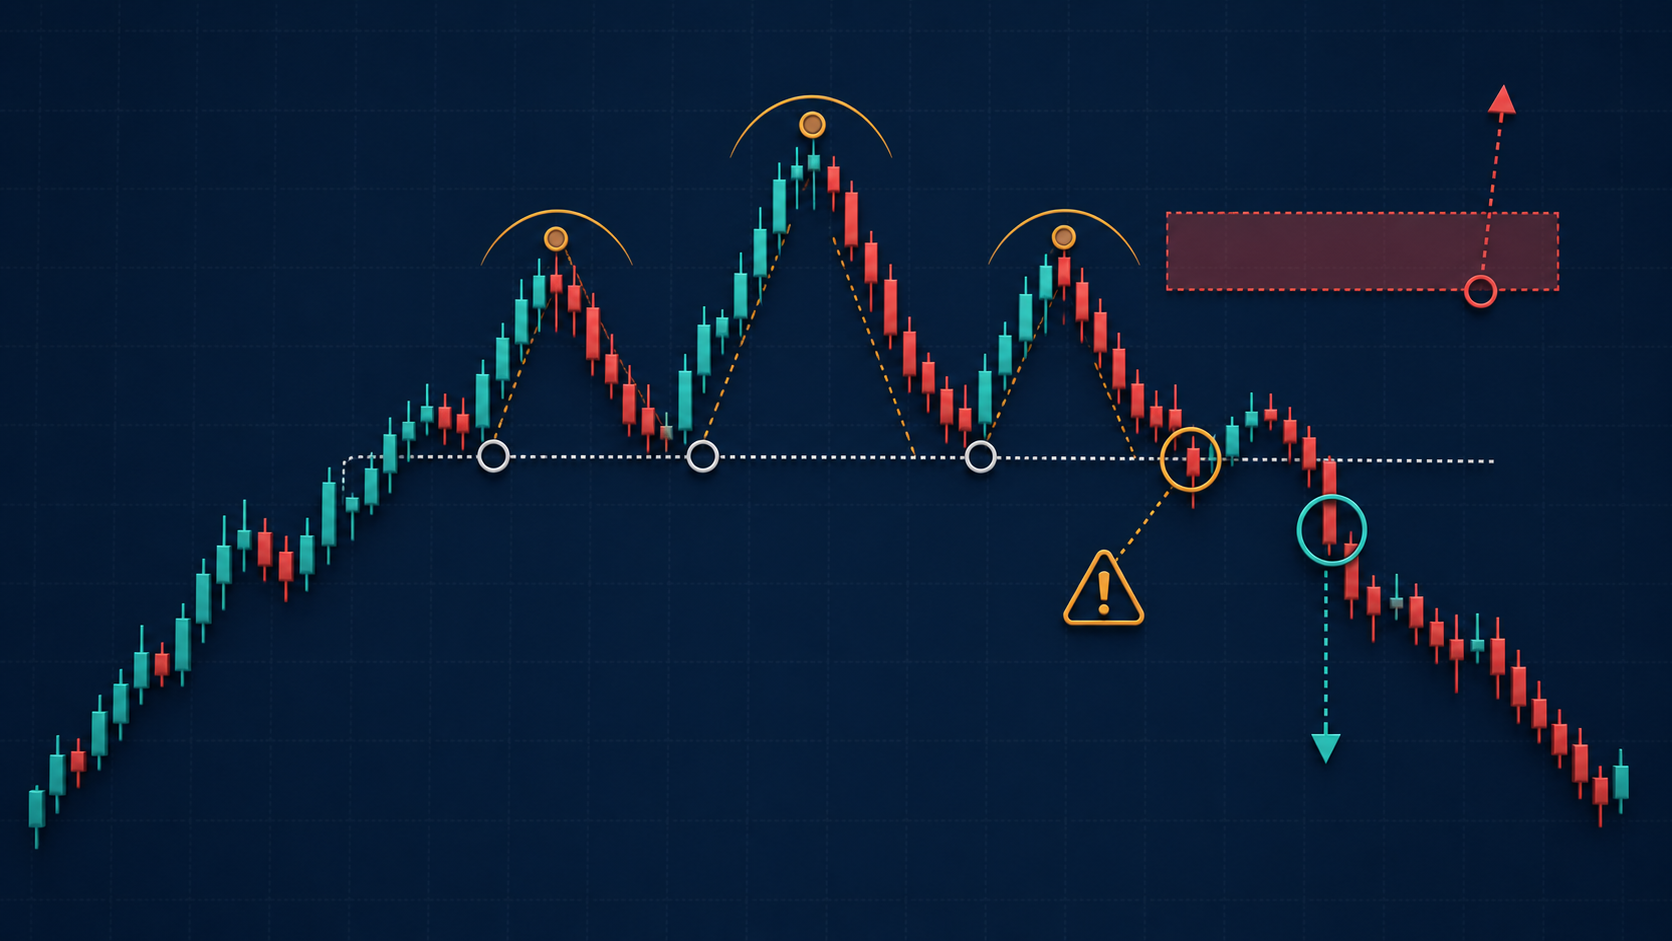
1. Head and shoulders without a real break
Three peaks do not automatically create a head-and-shoulders reversal. The middle high should be meaningfully higher than the shoulders, and the neckline should connect relevant reaction lows. Even then, the formation is only developing until price breaks the neckline in a way that fits your written rules.
The common mistake is selling the right shoulder because the picture looks nearly complete. If price never closes below the neckline—or immediately recovers above it—the market has not confirmed the bearish premise.
A stricter method is to define:
the precise neckline;
whether confirmation requires a close, not merely a wick;
the maximum acceptable distance between the entry and invalidation;
what a failed break looks like; and
whether there is enough room to the next support area.
An angled or loosely drawn neckline can be valid. The more subjective the boundary, however, the more important it is to test the rule consistently.
2. Calling a double top or bottom too early
Two nearby highs are not enough for a completed double top. The low between them is the confirmation level. Before that low breaks, price may simply be consolidating below resistance.
The mirror image applies to a double bottom. Buying the second low can offer a better price, but it is an anticipatory entry with different probabilities and stop behavior from an entry after the intervening high breaks. Problems begin when a trader enters early but evaluates the result as if the confirmed pattern had been traded.
Separate the two strategies in your journal:
Anticipation: Enter near the second test with a tighter invalidation and a higher chance of being stopped before confirmation.
Confirmation: Enter after the middle swing breaks, accepting a later entry and possibly a wider stop.
Neither approach is inherently superior. They are different setups and should not share one performance record.
3. Treating every wick beyond a triangle as a breakout
Triangles compress price, but their boundaries are rarely exact. A brief move outside the shape may collect orders and return to the range. If your breakout rule triggers on the first tick beyond a line, false entries are inevitable.
Confirmation might require a candle close beyond the boundary, an expansion in range, a successful retest, or a period of price acceptance outside the structure. The best choice depends on the timeframe and method. The essential point is to specify it before the breakout occurs.
Also ask whether the triangle has a clear starting impulse. A shape drawn across random overlapping candles may be visual organization rather than a tradable compression.
4. Seeing flags and pennants in sideways noise
A flag is a continuation pattern, so it needs something to continue. The pole should represent a clear directional move. The consolidation should be relatively contained, and the proposed breakout should align with that prior move.
In a broad, overlapping range, small sloping channels appear everywhere. Labeling each one a flag creates too many signals and encourages selective hindsight. If you cannot identify the impulse without drawing the consolidation first, the pattern may be weak.
Before trading a flag, compare the size and speed of the pole with the correction. A deep, prolonged retracement can indicate that the original momentum has faded.
5. Treating support and resistance as exact prices
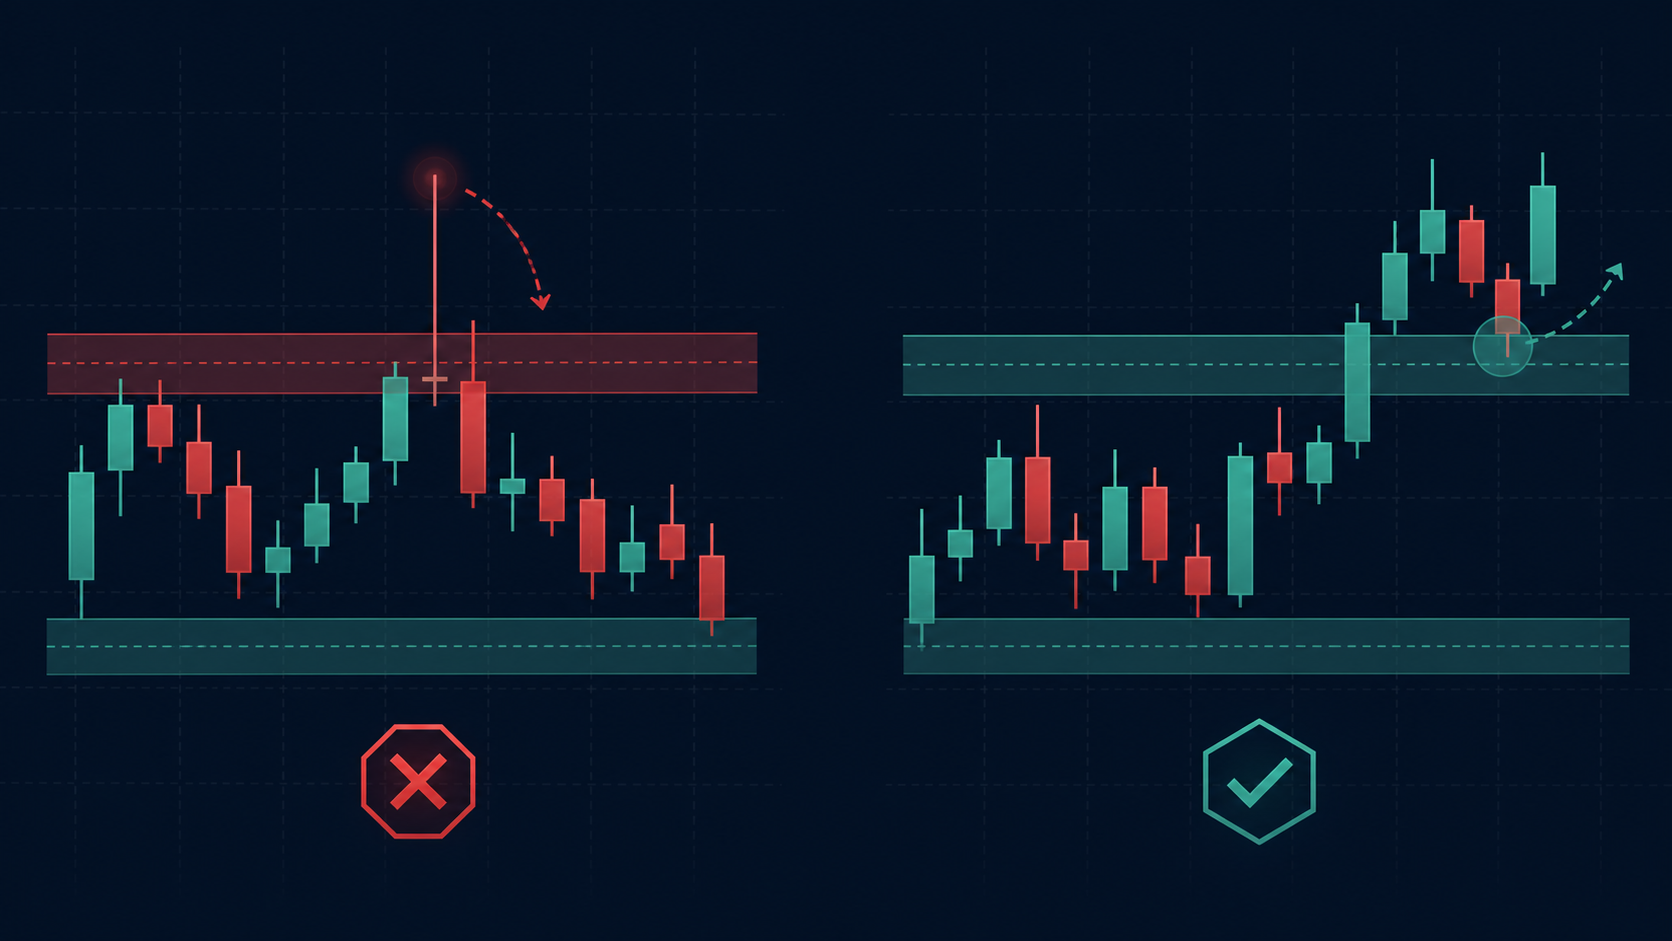
Markets often react around zones, not single-pixel lines. Different feeds, spreads, order types, and participants can produce slightly different highs and lows. A stop placed just beyond an obvious line may be vulnerable to routine testing even when the broader idea remains intact.
The answer is not an extremely wide stop. Define the zone, then place invalidation where the market structure—not your preferred position size—shows that the premise is wrong. Reduce position size if the structural stop is wider than the account-risk limit permits. If the resulting target no longer offers a reasonable reward relative to risk and costs, skip the trade.
6. Trading a single reversal candle without context
A pin bar, hammer, shooting star, or engulfing candle is evidence about one short period. Its location and the candles around it usually matter more than its name.
A bullish hammer after an extended decline into a higher-timeframe support zone tells a different story from the same candle in the middle of a range. Likewise, a bearish engulfing candle may be less useful if it closes directly into support.
Ask what the candle rejected, whether the rejection changed structure, and where the trade becomes invalid. If the only reason for entry is the candle’s shape, the setup may be too thin.
7. Using divergence as an entry trigger
Indicator divergence can warn that momentum is changing, but it does not specify when price will reverse. In strong trends, divergence can persist while price continues in the original direction.
Use divergence as supporting information, not a standalone order. Wait for price evidence such as a broken swing, failed continuation, or confirmed range exit. Decide which swing points are being compared; otherwise, the indicator can be redrawn until it supports the desired trade.
Timeframe Conflict and Hindsight Bias
The same price series can look bullish on one timeframe and bearish on another. That is not a contradiction. Each chart compresses different information.
A useful hierarchy gives each timeframe one job:
Context timeframe: Identifies the larger trend, range, and important areas.
Setup timeframe: Defines the pattern and invalidation.
Trigger timeframe: Refines the entry only if doing so improves execution without changing the original idea.
Too many timeframes create an escape hatch. A trader can keep switching charts until one confirms the desired direction. Limit the hierarchy in advance and record which timeframe had authority when signals conflicted.
Hindsight introduces another distortion. Once the outcome is known, clean patterns appear obvious and failed patterns seem badly drawn. Save a screenshot or export at the decision point, before the outcome. Mark the context, trigger, stop, target, and reason for cancellation. Review the information that was available at the time, not the finished chart.

Execution Errors That Make a Valid Idea Fail
Entering before the trigger
Anticipatory entries can be deliberate, but they need their own rules. If the plan requires a close beyond resistance, entering during the candle changes the method. A temporary breakout that disappears before the close is not a failed confirmed setup; it is an unconfirmed entry.
Moving the stop to protect the pattern
When price approaches the stop, it is tempting to widen the invalidation so the chart still “has room.” That converts a predefined loss into an open-ended decision. Place the stop where the premise fails, size the position from that distance, and accept the result unless the written management plan allows a specific adjustment.
Ignoring spread and slippage
Chart candles may display bid, ask, midpoint, or another feed depending on the platform. Stops and entries can be triggered on a different side of the quote than the visible candle suggests. Fast markets can produce fills away from the requested price.
Include realistic costs in testing. Investor.gov’s retail forex bulletin notes that transaction costs can turn otherwise profitable forex trades into losses, especially with frequent trading. A strategy with a small average target is particularly sensitive to spreads, commissions, and slippage.
Trading through major releases without a separate rule set
A pattern that completes just before a major announcement is exposed to event risk that the prior candles do not measure. If the strategy has not been tested for such periods, standing aside is a valid decision.
Changing definitions after each loss
If every failed trade leads to a new filter, the strategy can become fitted to the past. Make one controlled change at a time, record why it was made, and evaluate it over a meaningful sample rather than the next few trades.
A Practical Trade Chart Pattern-Validation Checklist
Before entering, answer each question in writing:
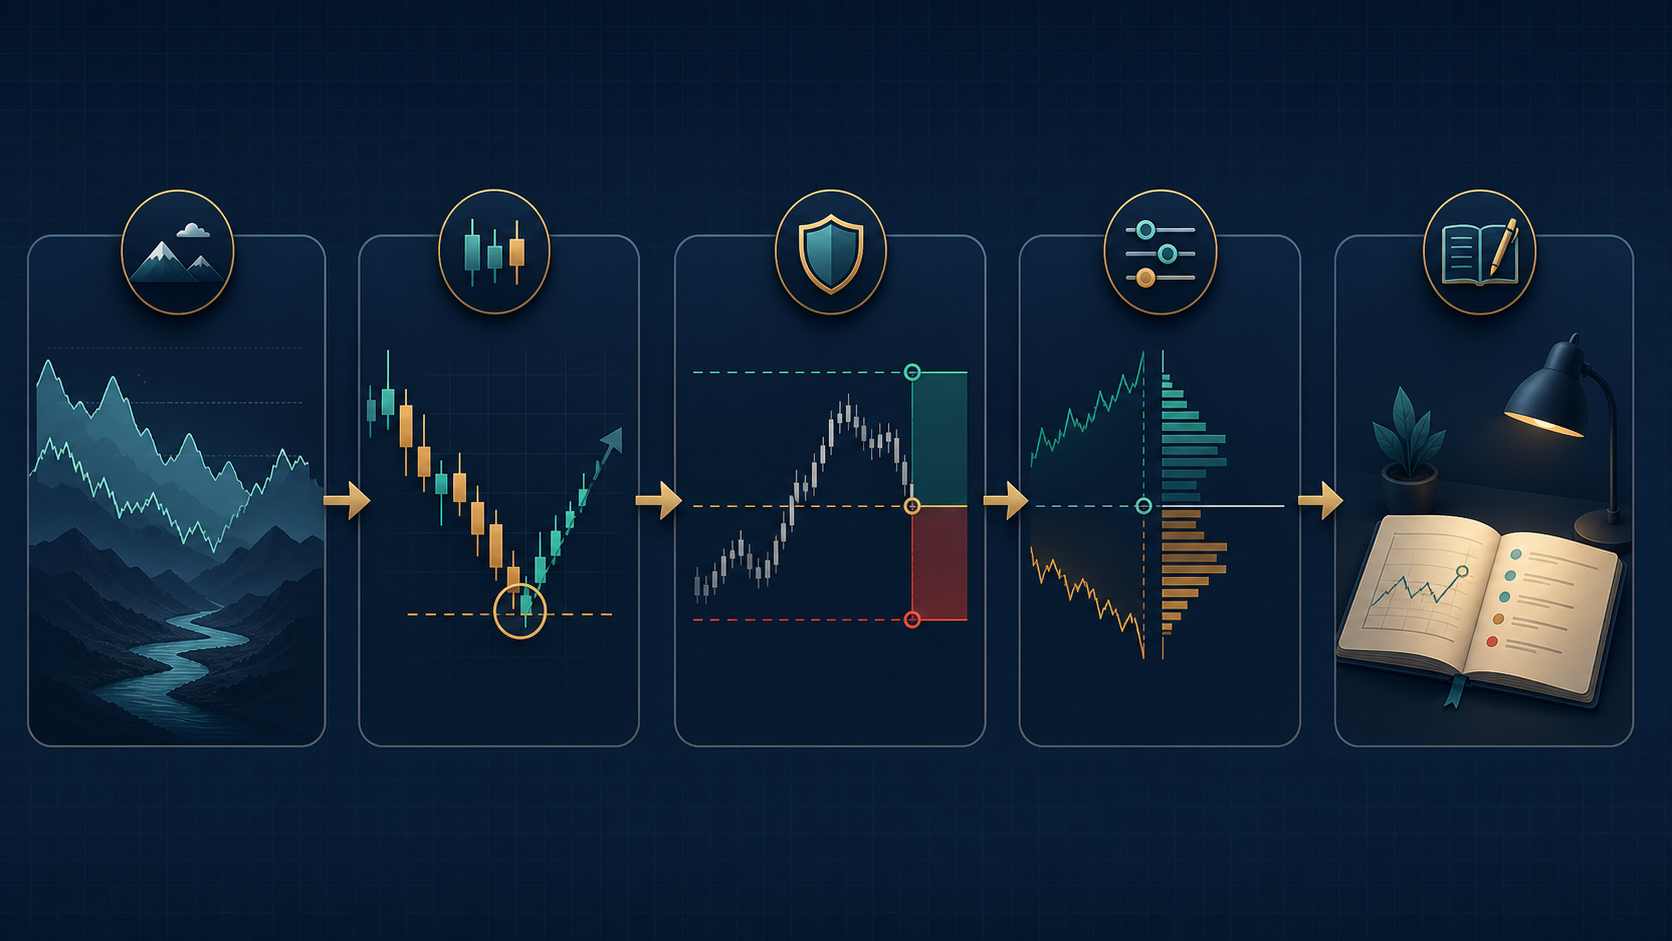
What is the market regime on the context timeframe?
Where is the pattern located relative to major structure?
What exact event confirms the setup?
Is the proposed entry anticipatory or confirmed?
What exact price behavior invalidates the idea?
Does the stop reflect structure and current volatility?
Is there a logical target before the next opposing zone?
Does the trade still make sense after spread, commission, and possible slippage?
Is a scheduled market event likely to affect the holding period?
Does the position size keep the loss within the account’s predefined risk limit?
What conditions would cancel the order before entry?
Have you saved the pre-trade chart for review?
If several answers are vague, the setup is not ready.
Build a Journal That Tests Decisions, Not Memory
Profit and loss alone cannot tell you whether a trade was well executed. A good setup can lose, and a poor decision can profit by chance. Record process variables:

| Field | What to record |
|---|---|
| Market regime | Trend, range, transition, or event-driven |
| Pattern and location | Formation plus nearby higher-timeframe structure |
| Entry type | Anticipatory, close confirmation, retest, or another defined trigger |
| Invalidation | Price level and the market reason behind it |
| Planned versus actual cost | Spread, commission, slippage, and financing where relevant |
| Rule adherence | Followed, partially followed, or violated |
| Outcome | Result in units of initial risk, not only money |
| Review note | One observation; no immediate rule change |
After a meaningful sample, separate losses caused by normal strategy variance from losses caused by rule violations. If confirmed setups work but early entries do not, the problem may be patience rather than pattern selection. If performance collapses only during high-volatility events, add a timing filter rather than redrawing every formation.
Broker and Trading Costs Belong in the Strategy
A trade chart strategy is implemented through a broker, so execution conditions are part of the system. Compare regulation and regional eligibility, spreads, commissions, financing, order handling, available account types, and withdrawal terms. The CFTC’s customer advisory on trading forex advises customers under its jurisdiction to research dealers and verify registration and disciplinary history. Traders elsewhere should use the relevant regulator for their country.
FXBEE publishes broker comparison and rebate information. Treat those pages as a starting point, not a substitute for checking the broker’s current legal entity, official disclosures, account agreement, and total costs. Rebates can reduce part of a trading cost, but they do not repair a negative-expectancy setup and should not encourage extra trades.
When the Best Chart Decision Is No Trade
Stand aside when:
the pattern has no clear invalidation;
the next opposing level leaves little room for the target;
the spread is unusually wide;
the market is moving around news your strategy does not cover;
higher and lower timeframes conflict and the rules do not resolve it;
the position would need to be too large to make the potential return feel worthwhile;
you are trying to recover a recent loss; or
you cannot explain the setup without changing the drawing.
A skipped trade has no visible reward, which makes restraint difficult. But avoiding undefined risk is part of the strategy, not a failure to use it.
Where FXBEE Fits
FXBEE describes itself as a third-party platform for forex rebates, trade-tracking information, rewards, and community features. Its terms state that it does not provide investment advice, manage funds, or execute trades. That boundary matters: pattern interpretation, broker due diligence, and risk decisions remain with the trader.
Before using any related service, review the current broker information, support details, terms, and privacy policy. Availability, eligibility, rebate rates, fees, and broker relationships can change by region and account type.
Frequently Asked Questions
Why does my trade chart strategy keep failing?
The pattern may be valid as a visual description but incomplete as a trade. Frequent causes include entering before confirmation, ignoring higher-timeframe structure, placing stops at arbitrary distances, trading through event volatility, and failing to include costs. Review a batch of trades by process variables rather than changing the strategy after one loss.
Are chart patterns reliable in forex trading?
Patterns are probabilistic, not reliable in the sense of guaranteeing an outcome. Their usefulness depends on how consistently they are defined, where they form, what confirms them, and how risk is controlled. A pattern with a clear invalidation can still lose while being correctly traded.
What is the most commonly misread chart pattern?
Double tops, double bottoms, and breakouts are often identified before confirmation. Traders may treat a second high as a completed double top or a brief wick beyond resistance as a breakout. Written confirmation rules reduce that ambiguity.
Should I wait for a candle to close before entering?
Only if candle-close confirmation is part of the tested strategy. Waiting can reduce some false breaks but may produce a later entry and wider stop. Entering early can improve price but increases the risk that the apparent signal disappears before the close. Test and journal them as separate methods.
How many timeframes should I use?
Many traders can organize a method with two or three: one for context, one for the setup, and an optional lower timeframe for entry. Adding more timeframes can create conflicting signals and make it easier to justify a trade after the fact.
Is a wick through support or resistance a breakout?
Not necessarily. A wick shows that price traded beyond the level, but it does not prove acceptance outside the range. A strategy may require a close, a retest, range expansion, or another predefined condition.
Why do my stop-loss orders trigger just before price reverses?
The stop may sit just beyond an obvious line rather than beyond the structural invalidation zone. Spread and volatility can also trigger an order even if the visible chart seems not to have reached it. Check which quote your platform displays and which quote activates the stop.
Can divergence predict a reversal?
Divergence can indicate changing momentum, but it does not provide precise timing. It may persist during a strong trend. Combine it with defined price confirmation and an invalidation level rather than using it alone.
How do spreads affect a chart strategy?
The spread increases the distance the trade must move before it becomes profitable and can change when an entry or stop activates. Strategies with small targets or frequent trades are especially sensitive. Include spread, commission, and slippage in testing.
Should I trade chart patterns during major news?
Only if the strategy has specific, tested rules for those conditions. News can cause rapid repricing, wider spreads, gaps, and slippage. Standing aside when event risk is outside the method is a legitimate risk decision.
Can forex rebates make a weak strategy profitable?
Rebates may reduce part of the transaction cost, but they do not correct poor entries, uncontrolled risk, or a strategy with negative expectancy. Compare total costs and avoid increasing trade frequency merely to earn a rebate.
How can I improve my chart-reading process?
Use fixed definitions, save the chart before the outcome, score rule adherence, and review a meaningful sample. Change one variable at a time. The goal is not to make every prediction correct; it is to make decisions consistent enough to evaluate.