
A trade chart tells you what price is doing. Technical indicators organize information derived from that price. The practical question is not which one is “better”; it is which tool adds clarity to the decision you are making without hiding risk or encouraging an overconfident entry.
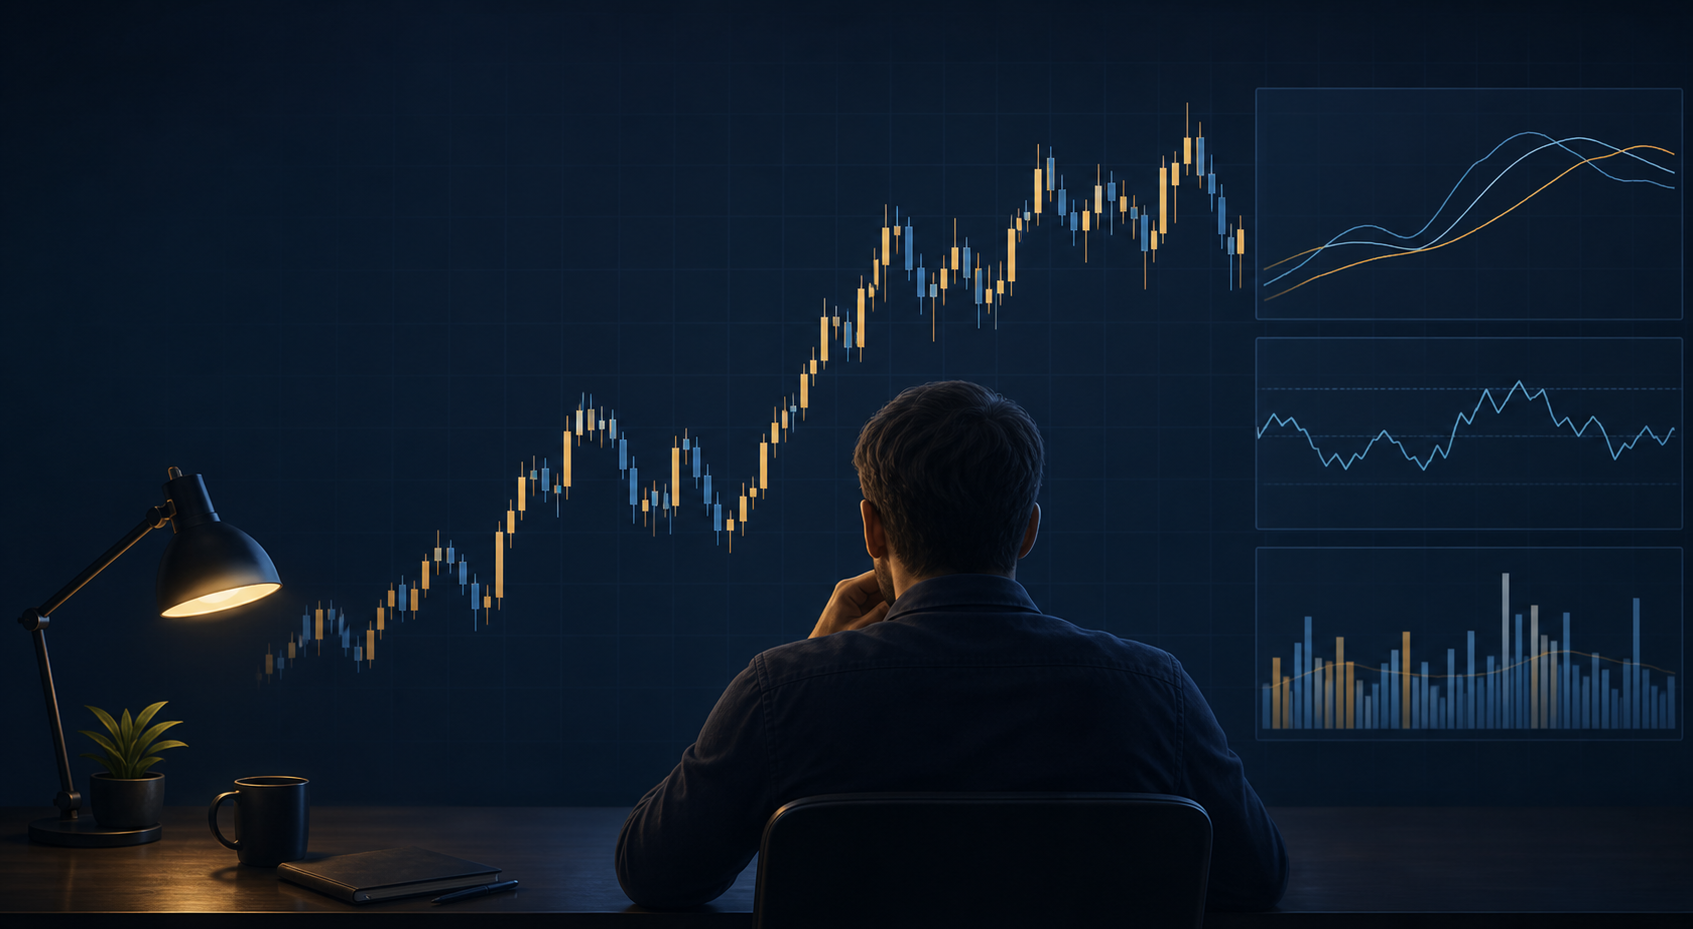
The short answer: start with the trade chart, then add only useful indicators
For most Forex traders, the price chart should be the foundation. It shows the sequence of highs and lows, the pace of a move, areas where price previously paused, and the timeframe on which the idea makes sense. Indicators can help answer narrower questions—such as whether a trend is persistent, whether volatility has expanded, or whether momentum has weakened—but they cannot turn an unclear setup into a sound one.
A good default is one price chart, one higher timeframe for context, and no more than one or two indicators that you can explain in plain language. If removing an indicator would not change your trade plan, it is probably decoration rather than decision support.
| Use a trade chart for | Use an indicator for | Avoid relying on either for |
|---|---|---|
| Market structure, levels, range boundaries, and entry location | Trend filtering, momentum context, volatility, or a repeatable confirmation rule | Guaranteeing direction, forecasting news reactions, or justifying too much leverage |
| Defining where the original idea is invalid | Making a rule easier to apply consistently across many setups | Replacing position sizing, a stop plan, or due diligence on a broker |
What a trade chart gives you that indicators cannot
Indicators are calculations based on price, volume, or both. That means they summarize what the chart has already recorded. A chart-first view preserves the context behind the calculation: whether a move began from the middle of a range, pushed through a prior swing, stalled at a level, or accelerated after a scheduled event.
Start by marking only the information that changes your decision: the prevailing structure on a higher timeframe, a nearby support or resistance area, and the level that would make the idea wrong. This is more useful than drawing every historical line. An area deserves attention when it offers a reason to enter, a place to exit, or a reason to stand aside.
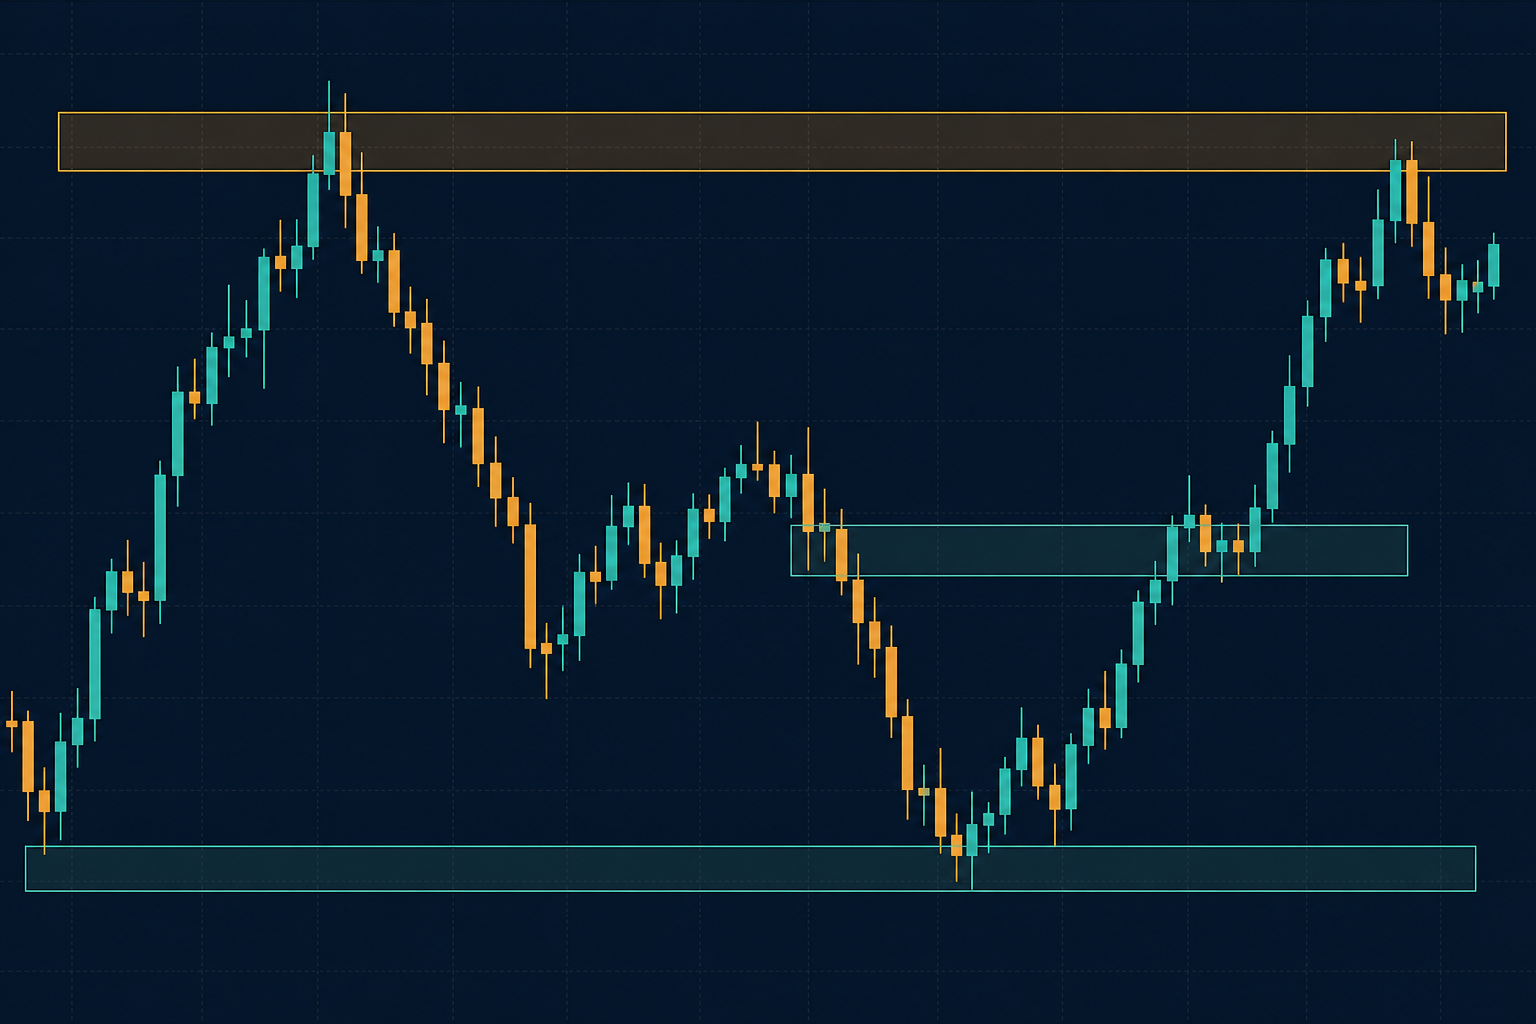
Three chart questions to answer before adding a tool
What is price doing on the timeframe that matters? A series of higher highs and higher lows is different from a sideways range, even if the same oscillator reading appears in both.
Where is the proposed trade located? A breakout near a well-defined boundary has different risk than chasing a move far from a logical invalidation point.
What would invalidate the idea? Put this in the plan before deciding how much to risk. If no invalidation level is clear, an indicator reading does not solve that problem.
Where technical indicators earn their place
Technical indicators are most helpful when they reduce a specific type of uncertainty. A moving average can be a simple trend filter. An RSI-style oscillator can make you notice momentum conditions. An average true range measure can prevent a stop from being placed unrealistically close during a volatile session. None of these tools is an instruction to trade by itself.
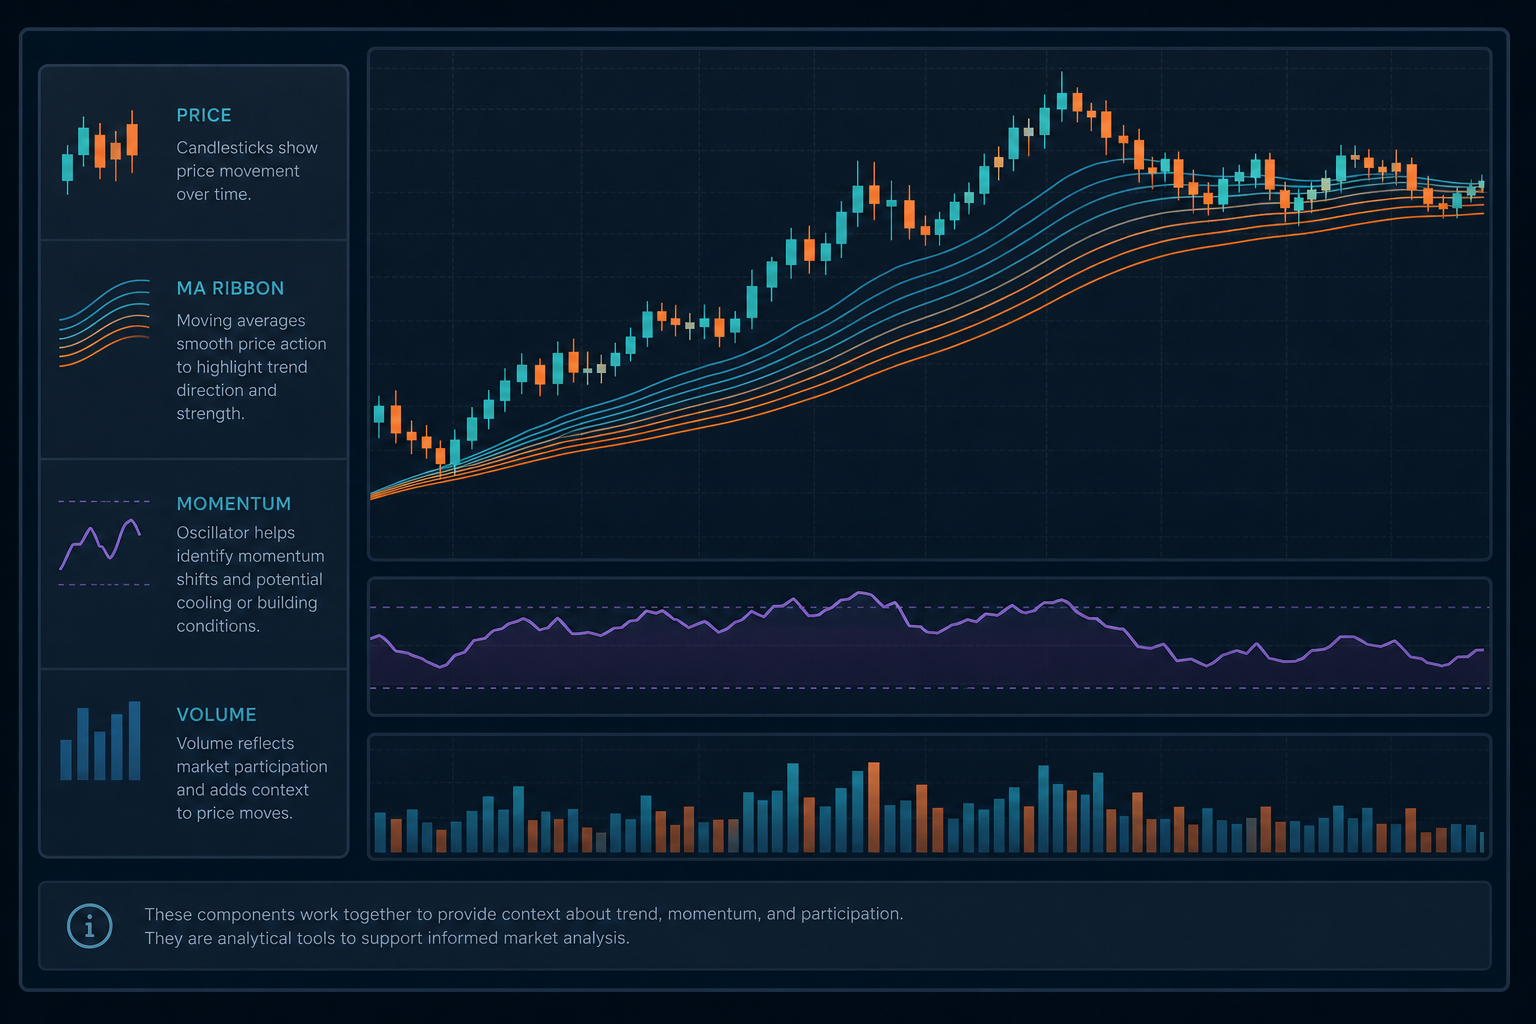
| Tool | Useful question | Common mistake |
|---|---|---|
| Moving average | Is price generally holding above or below a chosen trend reference? | Treating every crossover as a fresh opportunity, especially in a range. |
| Momentum oscillator | Has momentum become unusually stretched or weakened relative to the recent move? | Assuming “overbought” automatically means price must fall. |
| Volatility measure | Is normal movement large enough that a fixed, tight stop is unlikely to fit? | Using volatility to rationalize a larger position instead of a smaller one. |
| Volume or tick-volume display | Did participation appear to change around a level on this platform? | Assuming a retail-platform volume feed represents the entire decentralized FX market. |
When several indicators all confirm the same idea, check whether they are simply repeating the same price input in different shapes. More agreement does not necessarily mean independent evidence. A clean setup with one filter is often easier to review honestly than a screen filled with correlated signals.
Match the trade chart to the holding period
Timeframe conflict is a frequent source of bad decisions. A five-minute pattern can look compelling while the daily chart is approaching a major range boundary. That does not make the short-term trade invalid, but it should change expectations, the amount at risk, or the decision to wait.
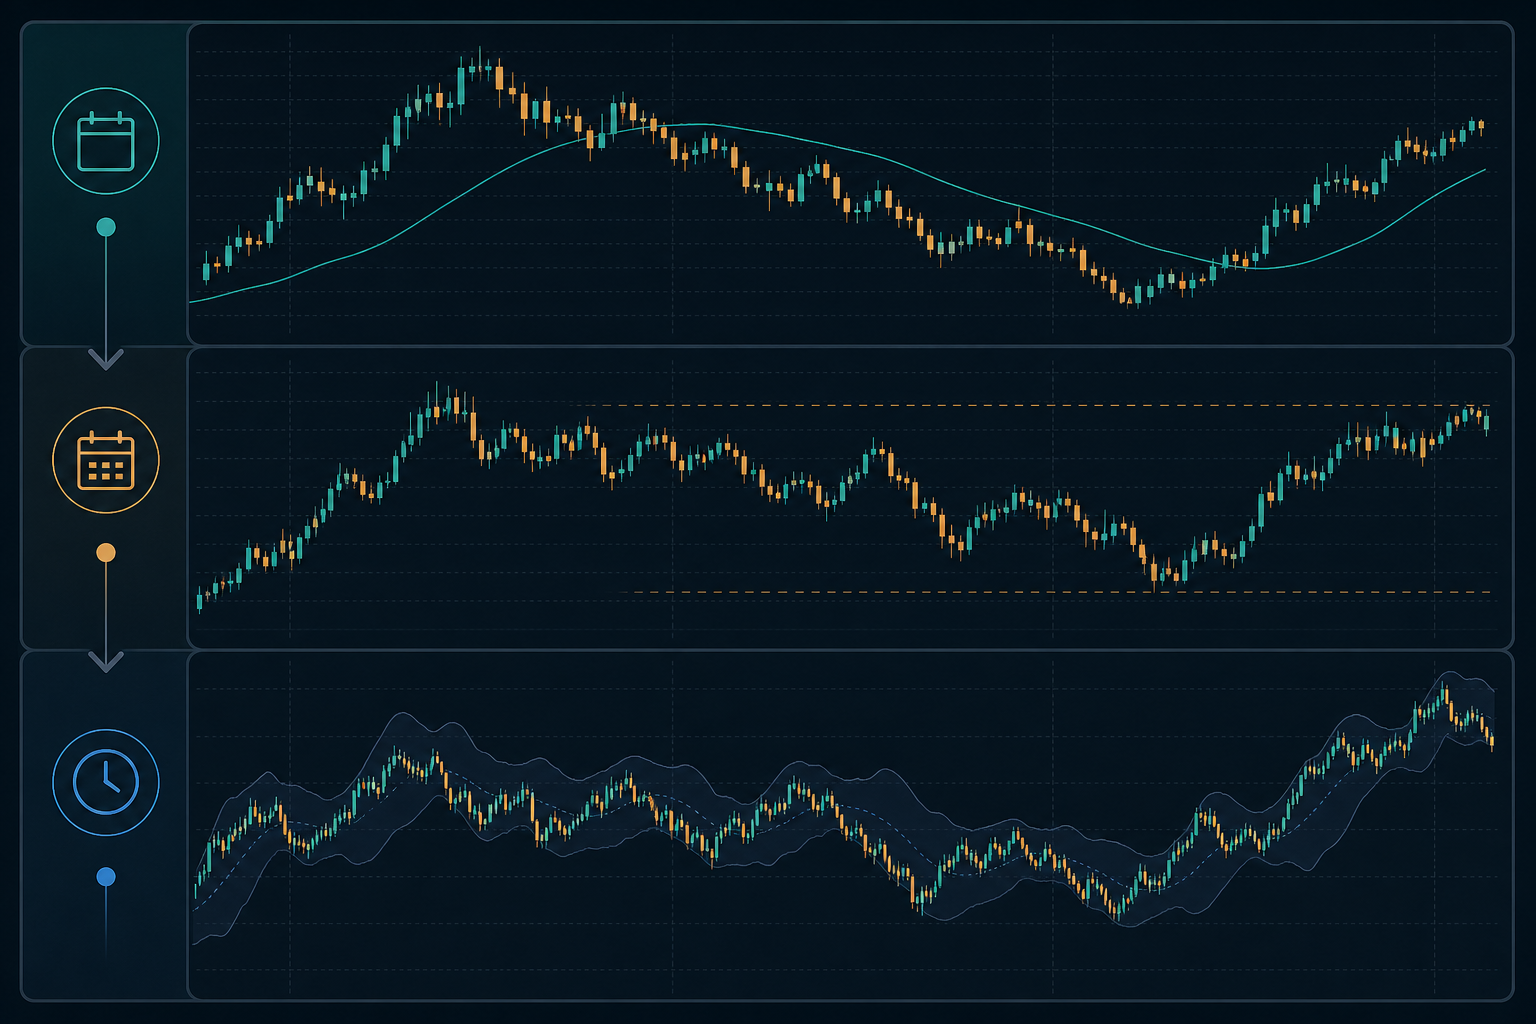
Context timeframe: Use it to see broad structure and nearby areas that may affect the trade.
Setup timeframe: Use it to define the pattern, range, pullback, or breakout condition you actually trade.
Execution timeframe: Use it only if it improves entry precision without changing the original thesis every few minutes.
Choose these timeframes from your available attention and holding period, not from the desire to find a signal. A trader holding positions for days needs a different trade chart setup from someone who can monitor a short session continuously.
A practical chart-first setup for a Forex trade
This framework is an educational planning routine, not a recommendation to buy or sell any currency pair. It is designed to make the relationship between chart context and technical tools explicit.
Choose one liquid pair and one session. Avoid building a plan while scanning many unrelated charts. Note scheduled economic events that may change spreads or volatility.
Read the higher timeframe. Identify whether price is trending, ranging, or transitioning. Mark only the nearest relevant areas.
Write the trade condition. For example: “I will consider a trade only if price retests this area and the setup timeframe closes back in the intended direction.” Keep the condition observable.
Add one indicator only if it has a defined job. A volatility measure could help set a realistic stop distance; a moving average could be a trend filter. Do not add it merely because it is popular.
Define invalidation and risk before entry. Determine where the plan is wrong, calculate the position size from that distance, and account for spread, commission, financing, and slippage where applicable.
Record the result and the process. A losing trade can still follow a sound process. Review whether the chart condition, indicator rule, and risk plan were followed rather than judging the setup solely by profit or loss.

When fewer indicators are better
Strip the setup back when you cannot describe why each line is present, when the tools contradict each other constantly, or when you keep changing settings after the market moves. These are signs that the chart is being used to search for permission rather than test an idea.
Also be cautious about copying indicator settings from social media without knowing the market, timeframe, and risk rules behind them. The US Commodity Futures Trading Commission warns that retail OTC Forex is high risk and advises people to investigate dealers and claims carefully; in particular, it notes that a dealer controls the platform used for OTC Forex trading. Read the CFTC’s Forex customer advisory before funding an account or acting on promotional trading content.
US broker and risk checks before you use any setup
A polished trade chart is not a substitute for checking who is offering the account, how it is regulated, and what it costs. For US residents, verify the firm and relevant individuals through the National Futures Association’s BASIC due-diligence resource and review the broker’s disclosures, account agreement, funding and withdrawal terms, and conflict-of-interest information.
The CFTC specifically advises prospective customers to check registration and disciplinary history and cautions that leverage amplifies gains and losses. Do not treat a chart pattern, signal provider, rebate, or copy-trading display as a promise of a result. Forex trading can lead to the loss of all funds committed and may not suit every investor.
FXBee describes itself as a third-party platform for rebates and trade-tracking information, not as a trade execution service or investment adviser. Its support information says strategy data is informational and not an endorsement of a trader or strategy; its terms state that availability depends on local law. If you are researching providers, review the available broker comparison information, but independently confirm US eligibility, registration, costs, and protections before opening or linking any account.
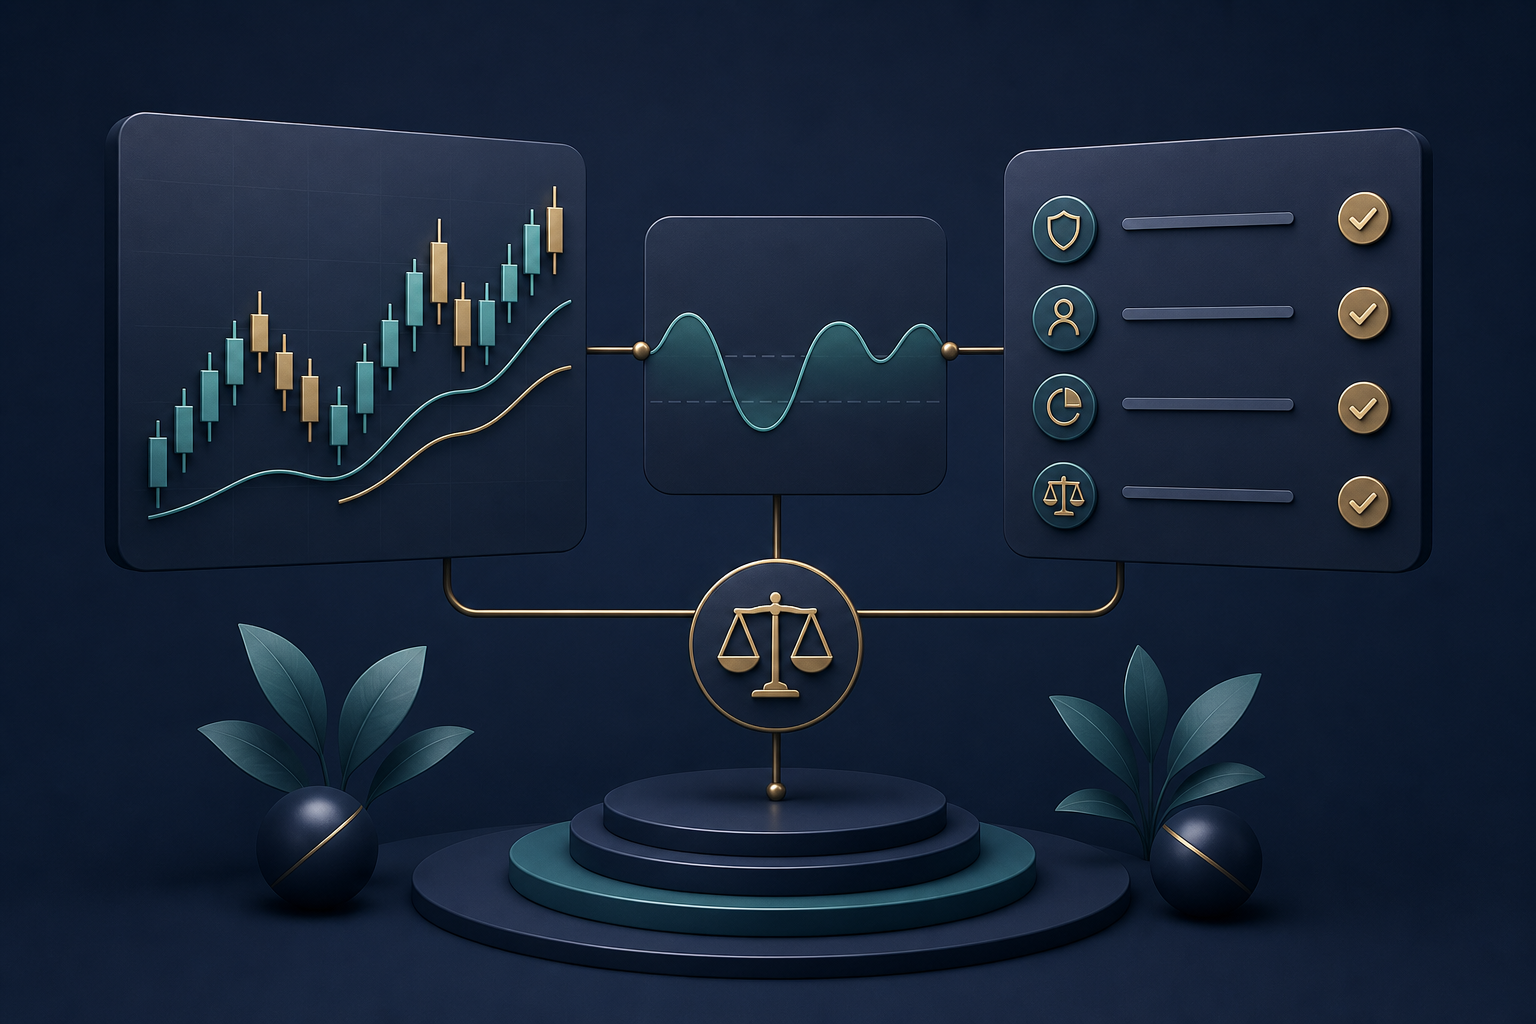
The right setup is the one you can explain and manage
Use the trade chart to understand location and structure. Add indicators only when they answer a question the chart alone does not answer cleanly. Then protect the process with a written invalidation level, position sizing, cost awareness, and broker due diligence. That combination is more durable than trying to discover a perfect indicator stack.
Frequently asked questions
Should I use a trade chart or technical indicators first?
Start with the trade chart. It shows market structure, location, and the level that would invalidate the idea. Add an indicator only after deciding what specific job it will perform, such as trend filtering or volatility context.
Are technical indicators reliable in Forex?
Indicators are calculations, not guarantees. Their usefulness depends on the market condition, timeframe, settings, costs, and the rest of the trade plan. Test a defined rule over enough examples and include losses, spreads, commissions, and slippage in the review.
How many indicators should be on a trade chart?
There is no universal number, but one or two purpose-built indicators is a sensible starting point. Remove anything that does not change a pre-defined decision. A crowded chart often repeats the same price information and makes reviews harder.
Is price action better than indicators?
Neither is inherently superior. Price action is usually better for understanding location and structure; an indicator can make a repeatable filter or volatility rule easier to apply. The useful test is whether the tool improves a documented decision without adding false certainty.
Which indicator is best for a beginner?
Choose an indicator with one clear purpose rather than searching for a “best” tool. A simple moving average or volatility measure can be easier to understand than a complex multi-signal script, but it still needs a written rule and risk limits.
Do indicators work better on longer timeframes?
Longer timeframes can reduce some short-term noise, but they also produce fewer opportunities and usually require wider risk parameters. Match the timeframe to your holding period, available attention, and account-risk plan rather than choosing it solely for a smoother indicator reading.
Can RSI tell me when to buy or sell?
RSI can describe recent momentum relative to its calculation window, but it cannot guarantee a reversal or continuation. A market can remain stretched for longer than expected. Use it as context alongside price location, invalidation, and risk management.
What should I check before opening a Forex account in the United States?
Check the firm’s registration and disciplinary history, then read its account agreement, risk disclosures, fees, spread and commission model, funding and withdrawal conditions, and leverage rules. Use official CFTC and NFA resources for due diligence and verify current eligibility directly with the provider.
Can a rebate change my trading decision?
A rebate may affect the net cost of trading, but it should not be the reason to take more trades or use more leverage. Review current terms, account-type conditions, and any restrictions. Higher trading frequency can still increase exposure to spreads, commissions, and losses.