
A trade chart can feel like a wall of candles, lines, and numbers at first. The useful starting point is much smaller: identify the market’s direction, locate the decision area, and define what would prove your idea wrong. This guide uses forex-style candlestick charts, but the same reading process applies to many liquid markets.
Risk reminder: This is general education, not investment advice or a recommendation to trade. Retail forex is high risk, and leverage can magnify losses as well as gains. Only use money you can afford to lose, and verify any broker or service before funding an account.

What a trade chart is actually showing
A trade chart is a time-based record of price. On a forex chart, the vertical scale shows an exchange rate and the horizontal scale shows time. Each candle summarizes the open, high, low, and close for one chosen interval—such as five minutes, one hour, or one day.
The chart does not tell you what will happen next. It gives you context: where price has traveled, where buyers or sellers previously became active, and whether current movement fits the broader structure. That distinction matters. A neat pattern can still fail, especially around news, thin liquidity, or a fast change in sentiment.
For U.S. readers considering retail forex, the CFTC’s forex advisory is a worthwhile companion read: over-the-counter forex involves dealer and margin risk, and the regulator advises checking registration and disciplinary history before depositing funds.
First, learn the four parts of a candlestick
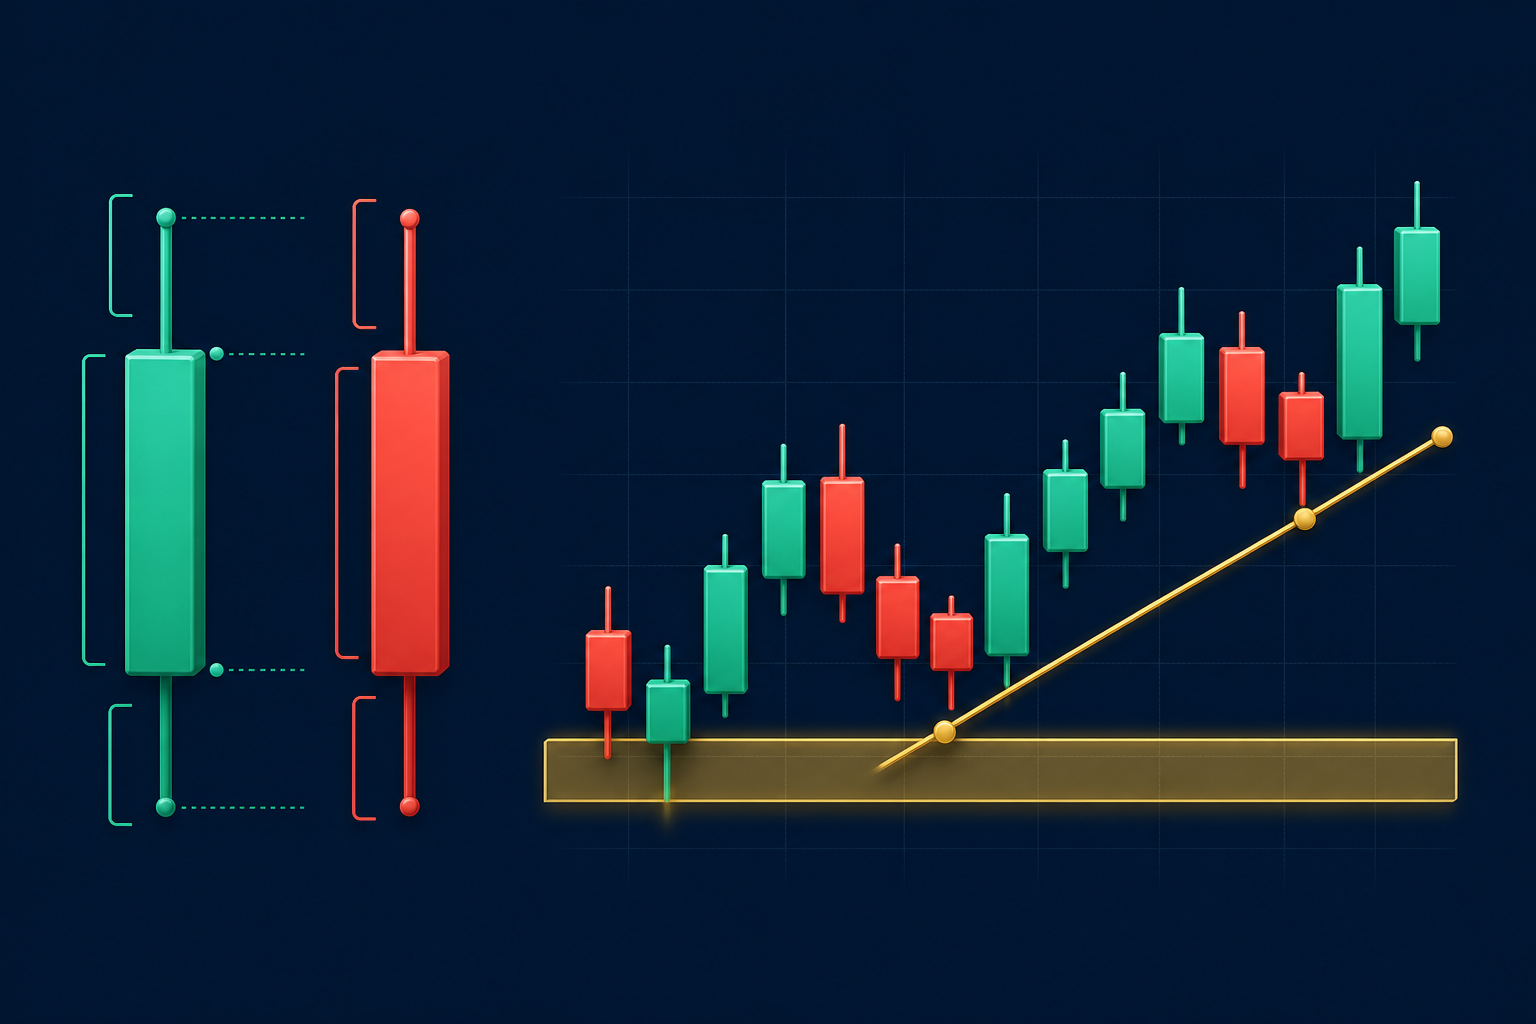
A candlestick is a compact price story for one period. The body marks the distance between the open and close. The thin lines above and below it—often called wicks or shadows—show the period’s high and low. A candle that closes above its open is commonly colored green; one that closes below its open is commonly colored red. Colors are a convention, so confirm your platform’s settings.
Open: where the selected period began.
Close: where it ended.
High and low: the furthest prices reached during that period.
Body and wick size: a clue to how far price moved and how much it was rejected—but not a standalone signal.
A long lower wick near an established support area can suggest buyers pushed price back up. It does not guarantee a reversal. Treat it as a question to investigate with trend, location, and risk—not as a command to buy.
How to read a trade chart in 3 simple steps
Use the same sequence each time. It reduces the temptation to choose a trade because one candle looks exciting.
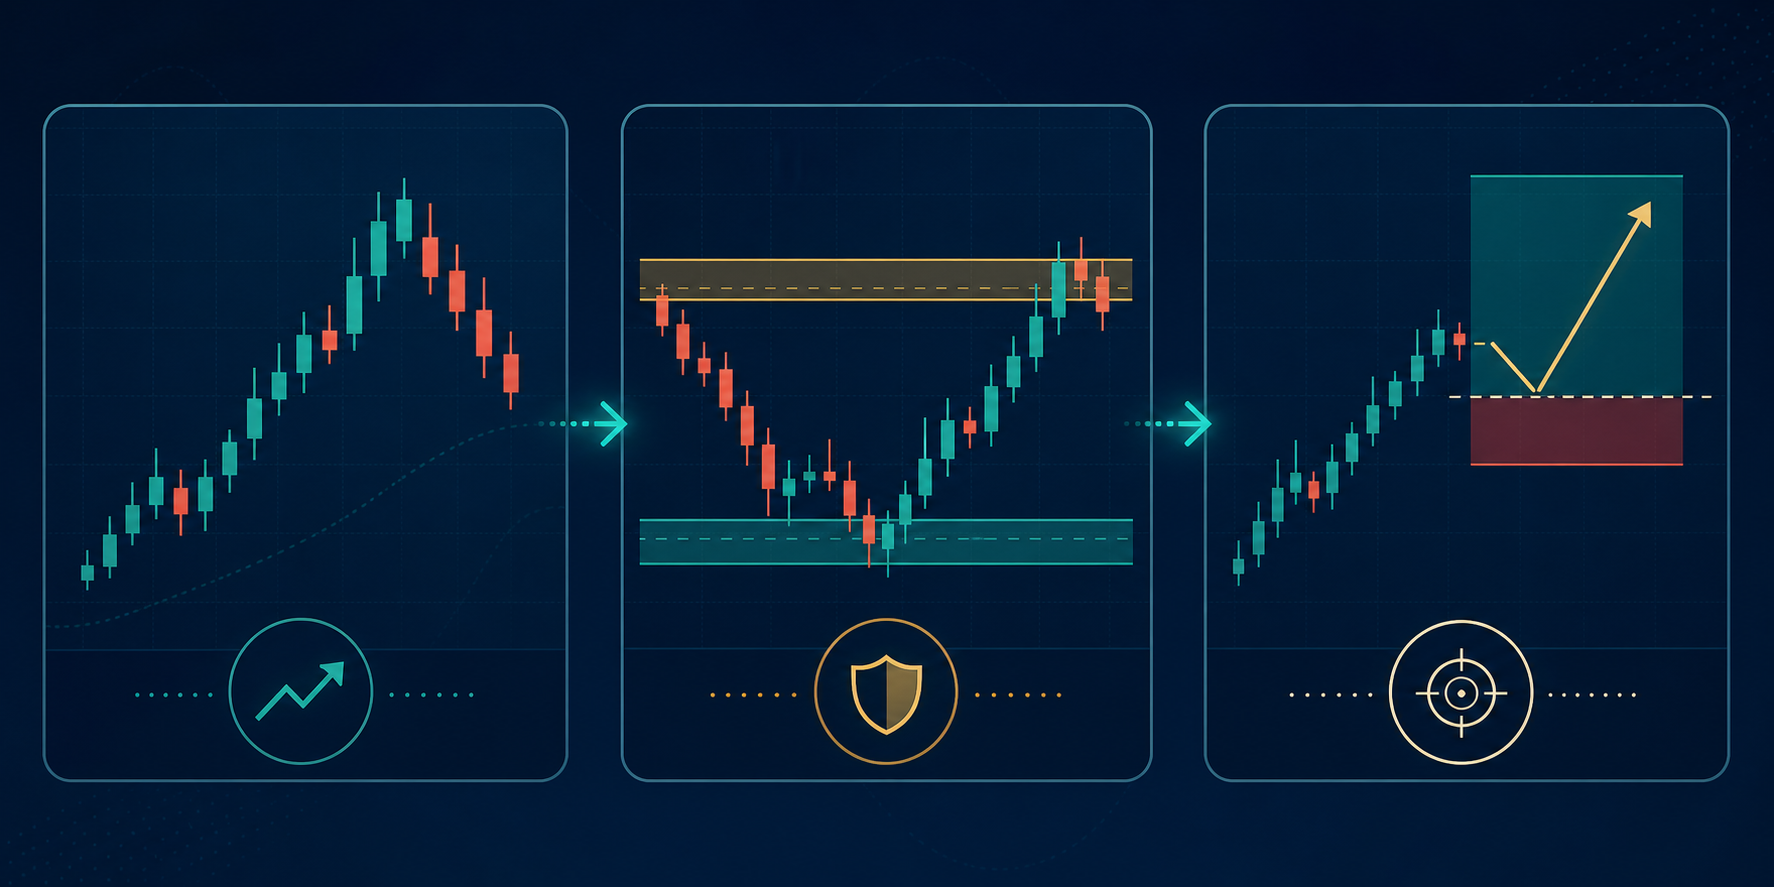
Step 1: Start with direction and timeframe
Zoom out before you zoom in. On the next-higher timeframe, ask whether price is generally making higher highs and higher lows, lower highs and lower lows, or moving sideways. That is your working context.
Then choose a lower timeframe only to refine the idea. For example, a trader may use a four-hour chart for direction and a fifteen-minute chart for timing. There is no universally correct pairing; the important part is consistency. A five-minute chart can be noisy, while a daily chart may require a wider stop and more patience.
If the chart is ranging, label it honestly as a range. Beginners often force a trend label because they want an obvious direction. A range can be tradable for some methods, but it calls for different expectations and usually tighter decision rules.
Step 2: Mark the decision area, not a magic line
Next, look left. Where has price repeatedly paused, reversed, or accelerated? Those regions can become support or resistance zones. Think in areas rather than exact lines because bid-ask spreads, liquidity, and volatility make precise turning points rare.
Use a small set of tools while learning: prior swing highs and lows, obvious consolidation areas, and perhaps one moving average if it supports your method. Adding five indicators does not create five independent confirmations; it often repeats the same price information in a busier format.
At the zone, wait for a defined behavior. Examples include a close back inside a range after a false break, a pullback that holds above a prior swing low in an uptrend, or a failed retest of resistance in a downtrend. The condition should be written before you place a trade.
Step 3: Build the risk plan before the entry
Before deciding how much to buy or sell, decide where the idea is invalid. A stop-loss location should reflect chart structure, not the amount of money you hope to make. If a normal fluctuation would hit the stop, the setup may need more room—or it may not suit your account size.
Set a maximum dollar amount or percentage you are prepared to lose on the idea, then calculate position size from the distance to the stop. Do not increase size just because a chart looks especially clear. A target can be based on the next meaningful area of opposing structure, but it is an estimate, not a promise.
A simple chart-reading example
Imagine EUR/USD has been making higher highs and higher lows on the four-hour chart. Price pulls back toward a former swing high that may now act as support. On a lower timeframe, you see price stop falling and close back above that zone.
This is not enough by itself to place a trade. Your next questions are: Where is the invalidation point? How far away is the next resistance area? Is the stop distance compatible with the amount I am willing to risk? Is a major economic release about to change volatility? If those answers do not fit your plan, passing is a valid decision.
The same logic works in reverse for a potential short: establish a bearish context, locate a potential resistance zone, define the condition that validates the idea, and put the invalidation point and size on paper before entry.

How to avoid common beginner mistakes
| Mistake | A better habit |
|---|---|
| Entering because one candle is large | Check the higher-timeframe structure and the nearby zone first. |
| Drawing support and resistance as exact prices | Use zones and allow for spread, volatility, and imperfect retests. |
| Moving a stop farther away after entry | Define invalidation before entry and reduce size if the needed stop is too wide. |
| Using more indicators to seek certainty | Keep the chart readable and test one clear method over many examples. |
| Copying a chart idea without checking the provider | Verify the broker, fees, disclosures, and any conflicts of interest yourself. |
The CFTC notes that leveraged OTC forex can expose customers to substantial losses and recommends skepticism toward claims of easy or low-risk returns. See its guidance on reducing forex-fraud risk before using any broker, signal seller, or managed-trading offer.
Use research tools without outsourcing your judgment
Once you can read basic structure, a comparison resource can help you organize research on broker costs and account choices. FXBee describes itself as a third-party platform for forex rebates, copy-trading insights, and community features; it states that it does not execute trades or provide investment advice. You can review its broker comparison page and support information as part of your own research.
That research should not replace independent checks. U.S. readers can use NFA BASIC and the relevant regulator records to check registration and disciplinary history. Read the broker’s account agreement, risk disclosure, spreads or commissions, withdrawal rules, and privacy policy before submitting personal information or funding an account.
Practice without turning every chart into a trade
Open a chart at the end of each day and annotate only three things: the broader structure, one decision zone, and the level that would invalidate a hypothetical idea. Then review what happened without pretending the result proves the method. Ten carefully documented observations teach more than ten impulsive entries.
A basic journal can include the pair, timeframe, chart context, entry condition, planned stop, planned target area, risk amount, and a note about whether you followed the plan. Include skipped trades too. They often reveal useful discipline: sometimes the chart did not meet the rules, and doing nothing was the correct action.

The beginner checklist
Identify the pair, timeframe, and broader market structure.
Mark one or two meaningful support or resistance zones.
Write the exact event that would make the setup valid.
Write the level that would invalidate it.
Calculate position size from the planned risk, not from confidence.
Check for scheduled news and decide whether your plan allows trading around it.
Record the outcome and whether you followed the process.
Reading a trade chart is not about predicting every candle. It is a way to make a repeatable decision: understand context, choose a location, and control the risk if the idea is wrong.
Frequently asked questions
Sources and safety note
Educational sources used in this guide: CFTC: Eight Things You Should Know Before Trading Forex; CFTC: Four Things That Can Help Reduce Your Risk of Forex Fraud; and NFA BASIC. Forex and CFDs involve significant risk and may not be suitable for everyone. Do not treat this page or any chart illustration as a signal, recommendation, or guarantee.