
A trade chart is most useful when it helps you notice the information that matters to your plan—and hides the rest. This guide shows U.S.-based forex traders how to build a practical, repeatable chart layout for monitoring global markets, planning trades, and reviewing decisions without treating a chart as a prediction machine.

Start with the job your trade chart needs to do
Before changing colors or adding indicators, decide when you will use the chart. A chart used to scan a watchlist needs fast comparison. A chart used to plan one trade needs room for price structure, invalidation, and upcoming events. A chart used during an open position may need fewer controls, not more.
Write one short sentence for the layout: for example, “I use this chart to prepare one currency pair before the U.S. session” or “I use this chart to review whether my setup rules were followed.” This decision prevents a common mistake: trying to make one crowded screen serve every task.
For U.S. retail traders, a custom chart should support research and risk discipline, not replace them. The CFTC’s forex-fraud guidance cautions that most retail forex traders lose money and that past results, signals, and automated tools cannot predict future conditions. Use your layout to make your own process easier to audit.
Step 1: Build a clean base trade chart
Choose one instrument per main panel. Start with a pair you have actually researched. Do not fill the screen with pairs simply because they are moving.
Set a primary timeframe. Pick the timeframe on which you make decisions, then use a higher timeframe for context and a lower one only if it has a defined purpose.
Use a readable price display. Candles or bars are both fine. What matters is that the body, wick, and grid remain legible at your normal screen size.
Keep the price scale stable. Avoid frequent zoom changes that make a routine move look dramatic or insignificant.
Show only the fields you will use. If a panel does not change a decision, remove it from the default layout.
Good chart customization reduces decisions at the wrong moment. A clean view makes it easier to answer: What market am I looking at? What timeframe is this? Where would the idea be invalidated? What would make me stand aside?
Step 2: Create a simple multi-timeframe view
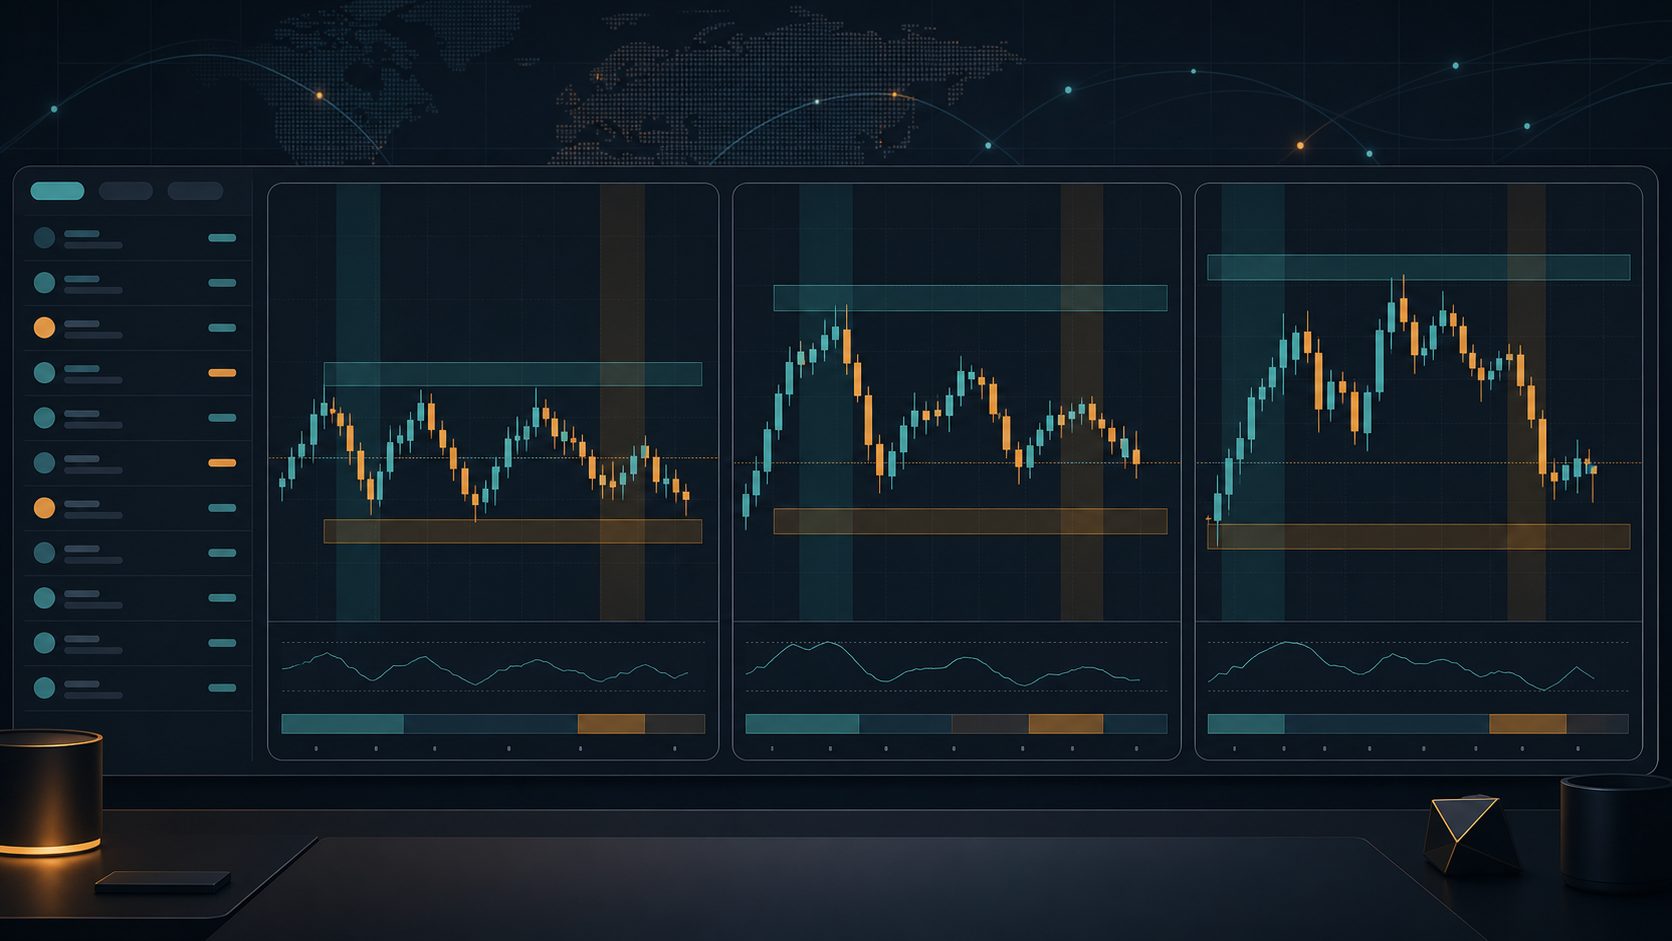
Multiple timeframes can clarify context, but only when each pane has a job. A practical starting layout is one higher-timeframe pane for broad structure, one decision-timeframe pane for the setup, and one optional lower-timeframe pane for execution timing. If you cannot explain why a pane exists, close it.
| Pane | Question it should answer | What to avoid |
|---|---|---|
| Higher timeframe | Where is price relative to the larger range or trend? | Using it to force a directional forecast. |
| Decision timeframe | Does the setup meet the rules you wrote? | Changing the rules after a move begins. |
| Lower timeframe | Is there a defined execution condition? | Watching every tick when it adds no decision value. |
Use matching colors for the same reference level across panes. For example, a higher-timeframe range boundary should look the same whether you see it on a daily, four-hour, or one-hour chart. Consistency reduces the chance of treating the same price level as different information.
Step 3: Add context in layers, not in a pile
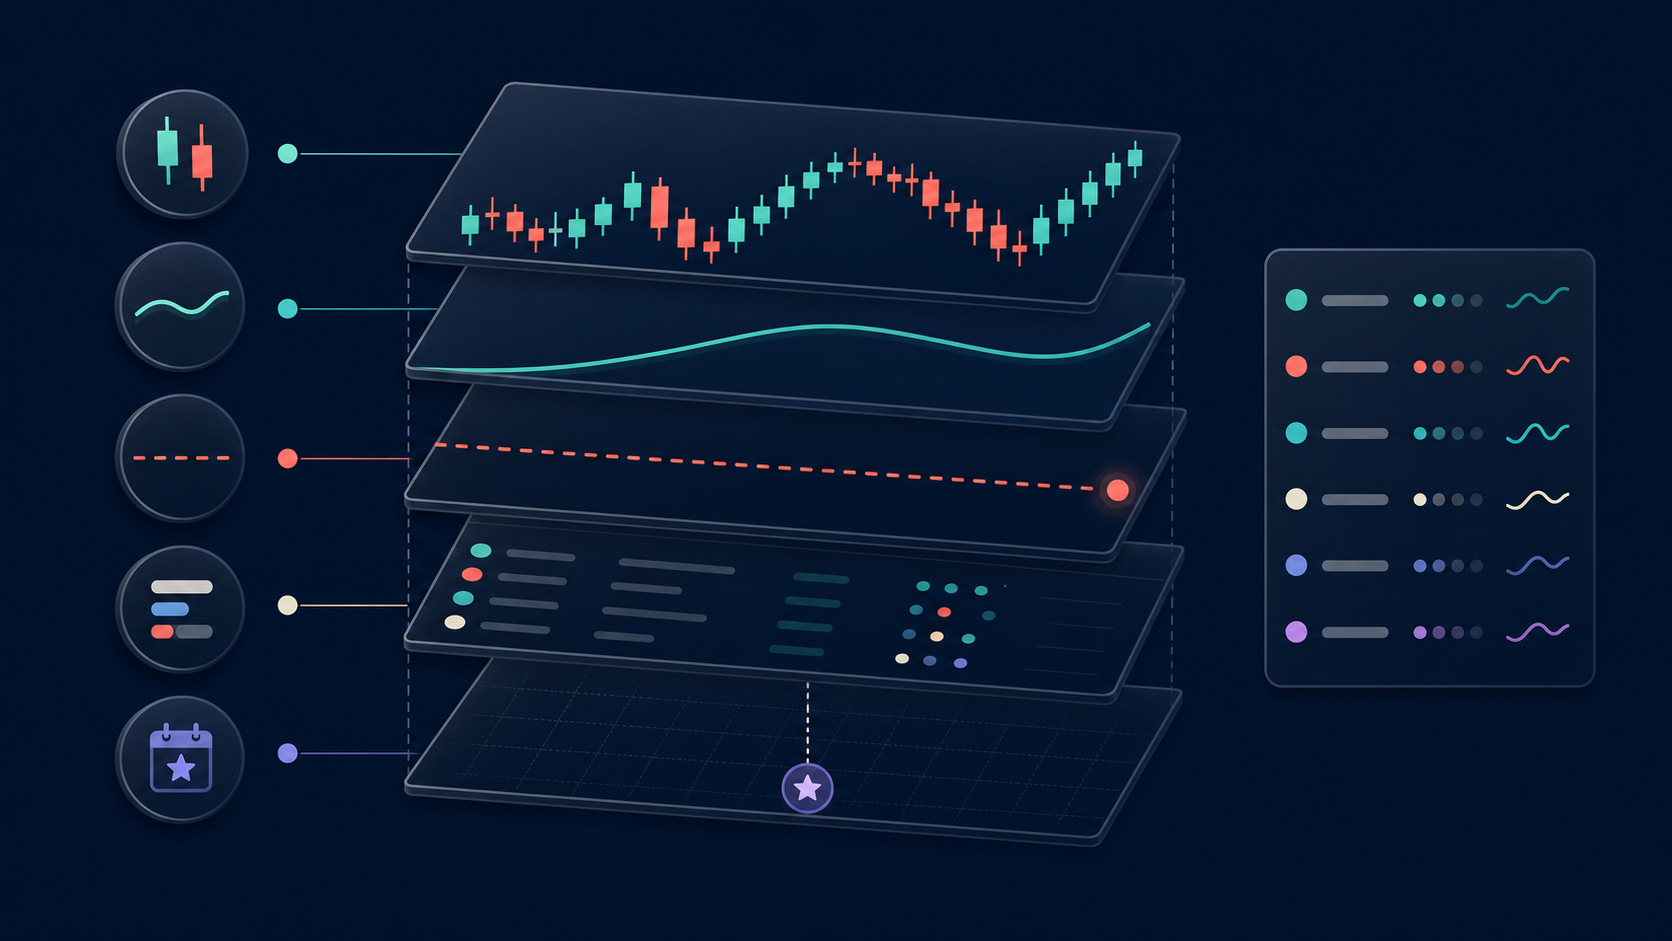
Indicators, sessions, volume tools, moving averages, and economic events can all be useful. The issue is not whether a tool is popular; it is whether it adds a distinct piece of information. Start with price and a small set of reference levels. Then add one tool at a time and keep it only if it answers a question price alone does not answer for your method.
A sensible layering order
Price and structure: key highs, lows, ranges, and areas you have defined in advance.
Time context: session separators or a time-zone setting that matches the way you plan. Check daylight-saving changes rather than assuming session times are fixed all year.
Event context: a calendar marker for scheduled economic releases, with enough room to see it without covering price.
One or two supporting measures: for example, a volatility measure or moving average, if your written plan explains exactly how it is used.
A good test is to hide an indicator for a week of review. If you make the same decisions without it, it is probably decoration. If you keep it, write the condition under which it matters. This makes your trade chart more consistent and makes later review more honest.
Step 4: Make the chart risk-first
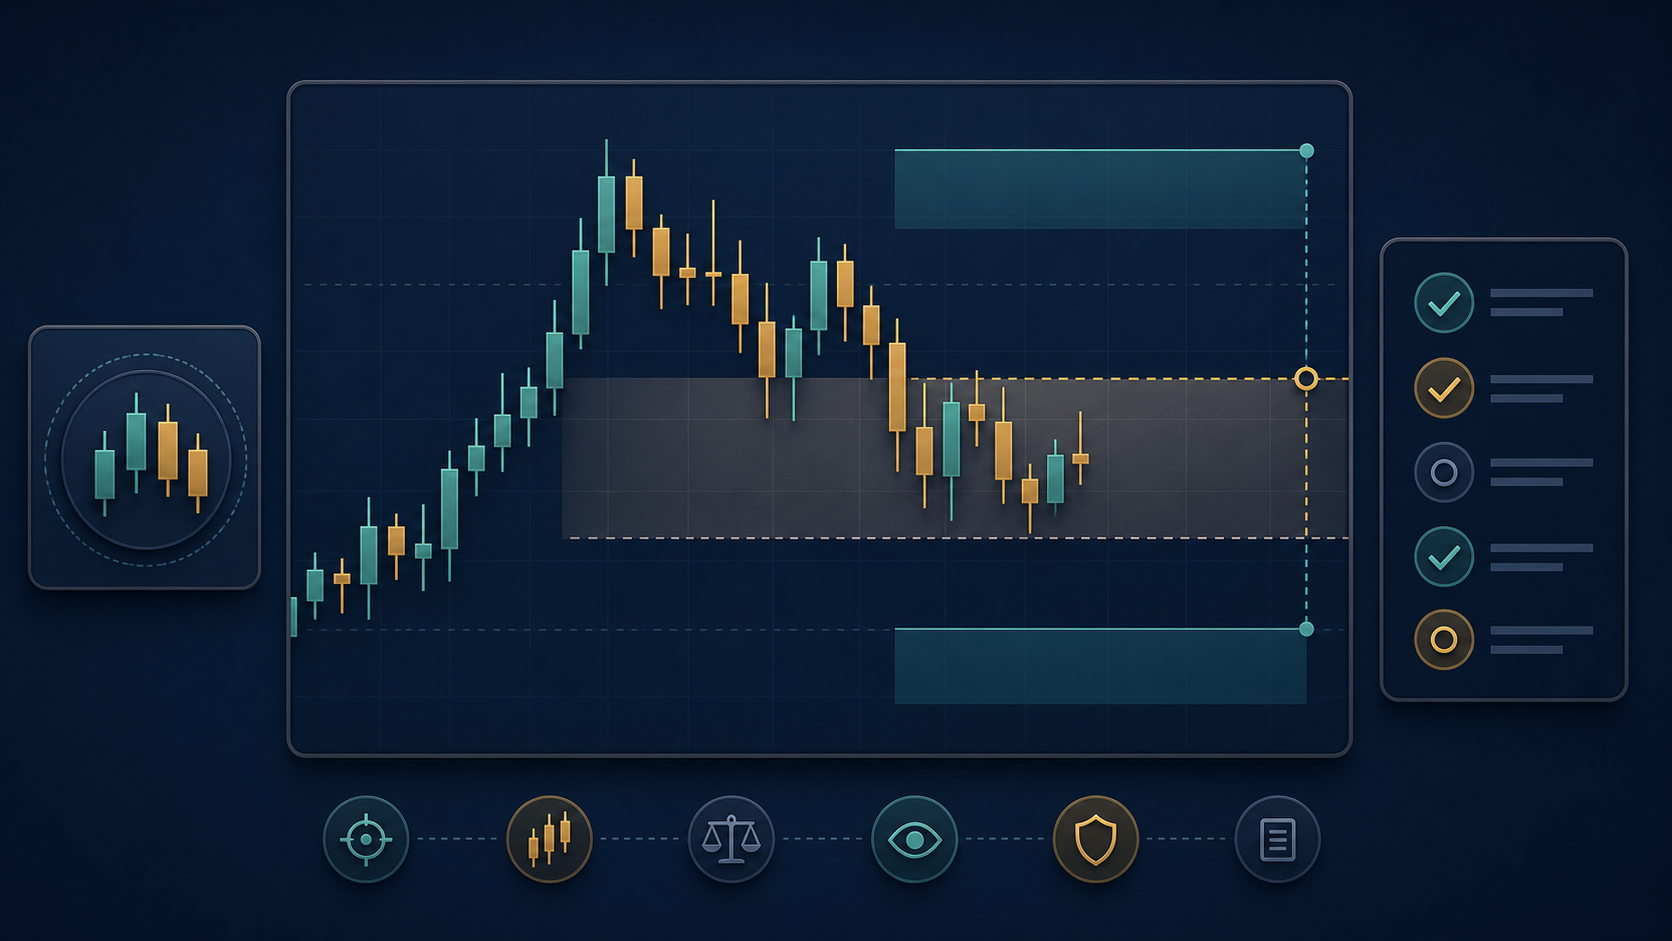
Price targets get attention because they are visually satisfying. The more useful customization is to make risk visible before an order is placed. Mark the price that would invalidate the idea, the amount of capital you are prepared to risk, and the conditions that would make you wait. These are planning prompts, not instructions to trade.
Use a distinct but restrained color for invalidation or stop reference levels.
Keep entry, exit, and alert lines visually different from ordinary support and resistance marks.
Add a small note field or linked journal entry for your setup criteria and the reason to stand aside.
Set alerts for levels you have already planned; do not use alerts as a reason to improvise a trade.
Margin can magnify losses, and forex trading is not appropriate for money you cannot afford to lose. Review account disclosures and the U.S. registration status of any dealer or professional before funding an account. The CFTC recommends using risk capital and checking registrations through the National Futures Association’s BASIC database; registration is a useful check, not a guarantee.
Step 5: Build a watchlist for global markets
A global market trade chart does not require a global list of instruments. Start with a short watchlist that fits your broker, schedule, and written approach. Group items by the reason you watch them: primary pairs, related pairs, and an optional cross-market reference. Keep the list short enough that you can explain why every symbol is there.
For each symbol, choose a compact set of columns such as current price, percentage change, spread information where your platform provides it, and the next scheduled event. Available instruments, account types, costs, and U.S. eligibility vary by dealer and can change. If you are comparing a provider’s terms or rebate program, use the live FXBEE broker comparison page as a starting point, then verify the broker’s own disclosures, registration, and account conditions before taking action.
Step 6: Save a template, then audit it
Save your main layout as a named template, such as “pre-session review” or “higher-timeframe scan.” Keep a second stripped-down template for moments when you need to step back from noise. Before you call a layout finished, use it through several market conditions and log whether it helped you follow your plan.
A brief review can reveal more than another indicator. Record what you noticed, which markings mattered, which settings distracted you, and whether you changed anything mid-trade. A chart template is working when it makes your process clearer—not when it makes every move look obvious afterward.

Where FXBEE fits in your research process
FXBEE describes itself as a third-party platform for forex rebate services, copy-trading insights, and related account tools; its support information states that it does not provide trade execution or investment advice. That distinction matters: chart customization is a personal research workflow, while broker choice, account eligibility, and order execution require separate due diligence.
Use FXBEE support resources for platform-specific questions and read the Terms of Use before using any service. For U.S. forex activity, independently confirm a dealer’s regulatory status, disclosure documents, product availability, costs, and suitability. Nothing in this guide is financial, legal, or tax advice.
A final checklist before you save the trade chart
The chart has one clearly defined job.
Each timeframe and indicator answers a separate question.
Time zone, session markers, and scheduled event settings are checked.
Risk and invalidation are visible before any execution decision.
Your watchlist is short, intentional, and reviewed regularly.
The layout is saved as a template and paired with a journal or review note.
FAQ: Customizing a Trade Chart
What is a trade chart?
A trade chart is a visual display of market price over time, often customized with timeframes, reference levels, alerts, and supporting tools. It can help organize research, but it cannot guarantee a trading outcome or predict the next price move.
Which timeframe should I use for a forex trade chart?
Use the timeframe that matches your written decision process. Many traders pair a higher timeframe for context with a decision timeframe for setup review. A lower timeframe should have a narrow, defined purpose rather than become a source of constant noise.
How many indicators should I put on a trade chart?
Start with none beyond price and clearly defined reference levels. Add an indicator only when it provides information that price alone does not provide for your method. If you cannot state how it changes a decision, leave it off the default view.
Should I customize chart colors?
Yes, when color improves recognition. Use consistent colors for the same kind of level, alert, or event across every pane. Favor readable contrast and avoid assigning meaning to a color that changes from one template to another.
How do I track global forex sessions on a chart?
Use session separators or calendar markers only if they help your analysis. Confirm the chart’s time zone and revisit session settings around daylight-saving changes. Session labels are context tools; they do not by themselves create a trading signal.
Can a chart template help manage risk?
A template can make planned invalidation levels, alerts, and event context easier to see. It cannot manage risk by itself. Account size, leverage, order handling, broker terms, and disciplined decision-making still matter.
Should I use copy-trading results to customize my chart?
No performance display should be treated as a guarantee or a substitute for understanding risk. Past results may not persist, and costs, market conditions, and strategy behavior can change. Review disclosures and independently evaluate any service or provider.
What should U.S. traders check before opening a forex account?
Check whether the dealer is registered and eligible to serve you, read its risk disclosures and account terms, understand all costs, and use only capital you can afford to lose. The CFTC and NFA provide resources for checking registration and learning about forex risks.
Does FXBEE provide investment advice?
FXBEE’s published support and terms materials say its services and support content are informational and do not provide investment, legal, or financial advice. Contact FXBEE directly for platform questions and obtain independent professional advice where appropriate.
How often should I review my trade chart layout?
Review it after a meaningful sample of planned observations or after your trading routine changes. Keep the layout stable long enough to assess it, then remove tools that add distraction and refine settings that make your rules easier to follow.
Risk notice
Forex and CFD trading involve substantial risk and may result in the loss of all invested capital. This article is for general educational purposes only and is not investment, legal, or tax advice. Check current U.S. eligibility, registration, disclosures, fees, and product terms directly with the relevant provider before acting.