
Miss the shift and a trade chart turns from signal to trap fast. Markets now move like a crowded freeway at rush hour, and slow data or sloppy execution gets you clipped before you even hit the gas.
Serious players aren’t guessing; they run indicators inside systems with feeds and fills. If your setup lags, those signals cost you money instead of making it.
Key Points: Trade Chart Mastery
Indicator Essentials
Focus on seven core tools—RSI, Fibonacci, MACD, Bollinger Bands, Volume Profile, ATR, and algorithmic MACD—streamlining your analysis.
Moving Average Tactics
Select SMA for stability, EMA for speed; employ crossovers and swing setups to capture spot-forex trends.
Execution Speed
Leverage OMS/EMS and FIX connectivity to minimize slippage and avoid late entries, syncing trades with ECNs and prime liquidity.
Risk Control with ATR
Use ATR-based position sizing and stop-loss levels, stress-testing under margin rules to safeguard against volatility spikes.
Too Many Indicators? Simplify To 7
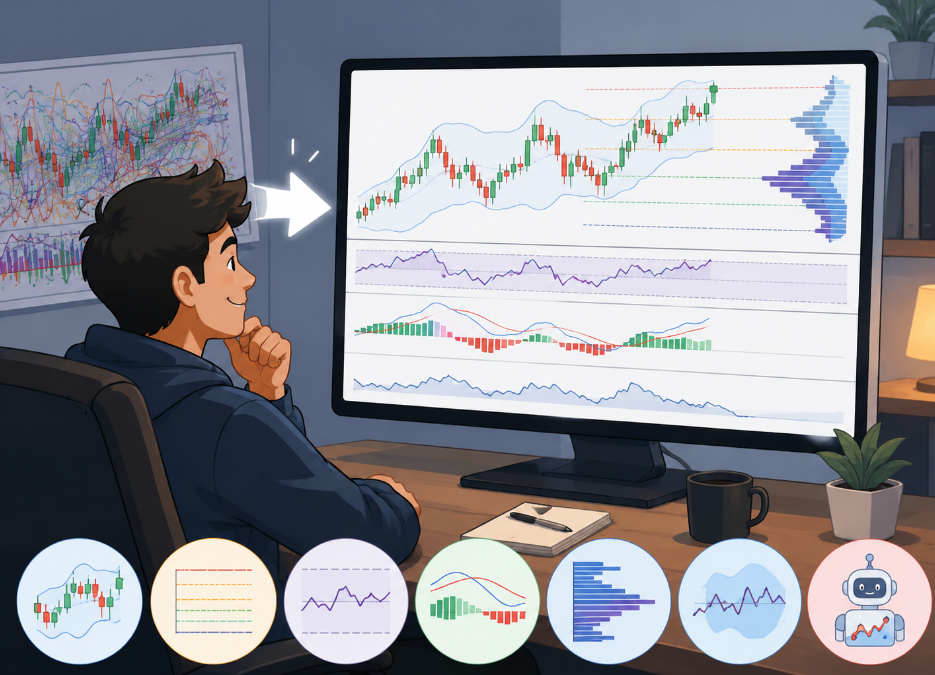
A crowded screen can make a simple decision feel messy. This guide narrows attention to seven widely used tools and shows how a clean trade chart can support clearer thinking. Across forex and futures markets, traders often compare a trade chart, price chart, and market chart while filtering noise. Fxbee promotes a focused approach rather than indicator overload.
Relative Strength Index (RSI) for Institutional Traders
With RSI acting as a momentum oscillator, many institutions, funds, and professional traders watch overbought and oversold readings on a trade chart. A quick check of the chart can help identify areas where liquidity and price reactions may align.
Fibonacci Retracement Levels in Major Currency Pairs
Fibonacci retracement levels are commonly mapped onto major forex currencies and changing exchange rates. Traders monitor potential support and resistance zones on a trade chart, especially when broader market trends remain intact.
Moving Average Convergence Divergence for Hedge Funds
Many hedge funds combine MACD with systematic investment strategies. The indicator, signal line, histogram, and broader trend can highlight shifts in momentum that may not be obvious on a basic market chart.
Bollinger Bands Applied to Exotic Currency Pairs
Bollinger Bands measure volatility through dynamic bands built around standard deviation. In exotic currencies and less liquid FX pairs, traders often watch for mean reversion opportunities while comparing price movement against a trading chart.
Volume Profile from ECNs and Prime Brokerage Services
A volume profile helps reveal market activity and liquidity across price levels. Data from ECNs, electronic networks, and prime brokerage providers can support institutional services and execution decisions where clearing quality matters.
Average True Range (ATR) as a Risk Mitigation Tool
ATR tracks volatility and typical price movement. As a practical trading tool, it supports risk management, position sizing, exposure control, and mitigation planning. Fxbee often highlights ATR as a simple addition to a clean trade chart.
MACD with Algorithmic Models on Futures Contracts
Modern systems pair MACD with algorithmic models and quantitative analysis. In automated trading across futures contracts, derivatives, commodities, and other financial instruments, traders use chart signals to identify momentum conditions while keeping analysis streamlined through Fxbee.
3 Steps To Master Moving Averages
Moving averages can make a busy market feel a lot less noisy. Used with a good trade chart routine, they help traders read direction, manage risk, and make cleaner decisions across currency markets.
Step 1: Selecting the Right SMA and EMA Settings
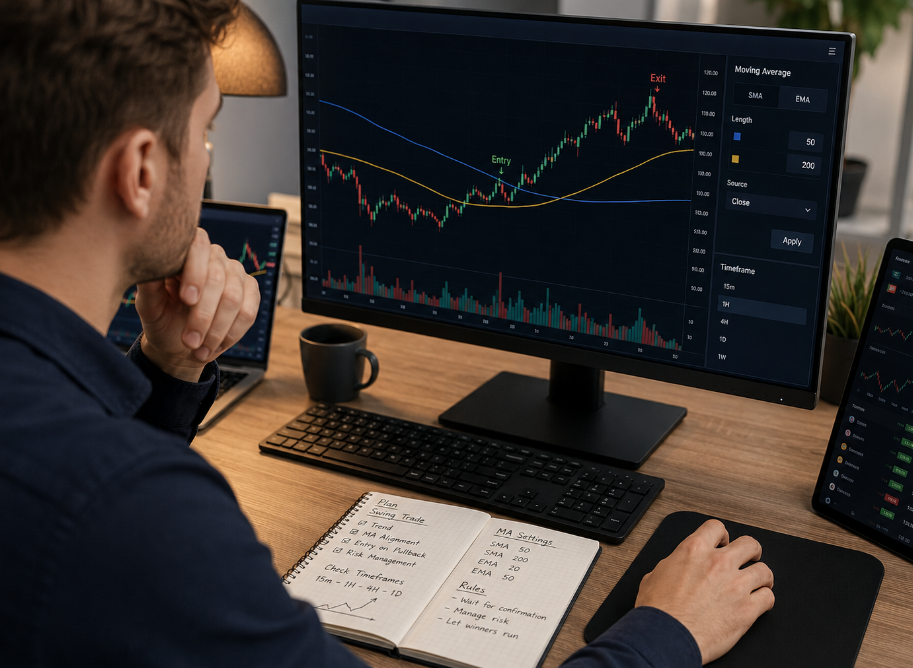
When choosing SMA and EMA, focus on the relationship between Settings, Period, and Timeframe rather than chasing a perfect number.
| Pair | SMA Period | EMA Period | Timeframe |
|---|---|---|---|
| EUR/USD | 20 | 12 | 1H |
| GBP/USD | 50 | 21 | 4H |
| USD/JPY | 100 | 50 | 4H |
| AUD/USD | 200 | 55 | 1D |
Many traders on Fxbee test a chart setup repeatedly before making changes. A trade chart should support consistency, not guesswork.
Step 2: Integrating Moving Averages into Swing Trading
In Swing trading, moving averages work best as part of a wider Strategy.
A trading chart becomes more useful when price action and macroeconomic themes point the same way. Fxbee users often combine moving averages with trend reviews instead of relying on a single indicator.
Step 3: Applying Crossovers for Spot Forex Entries
A trade chart showing aligned crossover signals and strong momentum can improve timing. Even then, every trade chart deserves a risk check before entry, helping traders stay disciplined while using Fxbee tools and analysis.
Avoid Late Entries: Trade Chart Signal Secrets
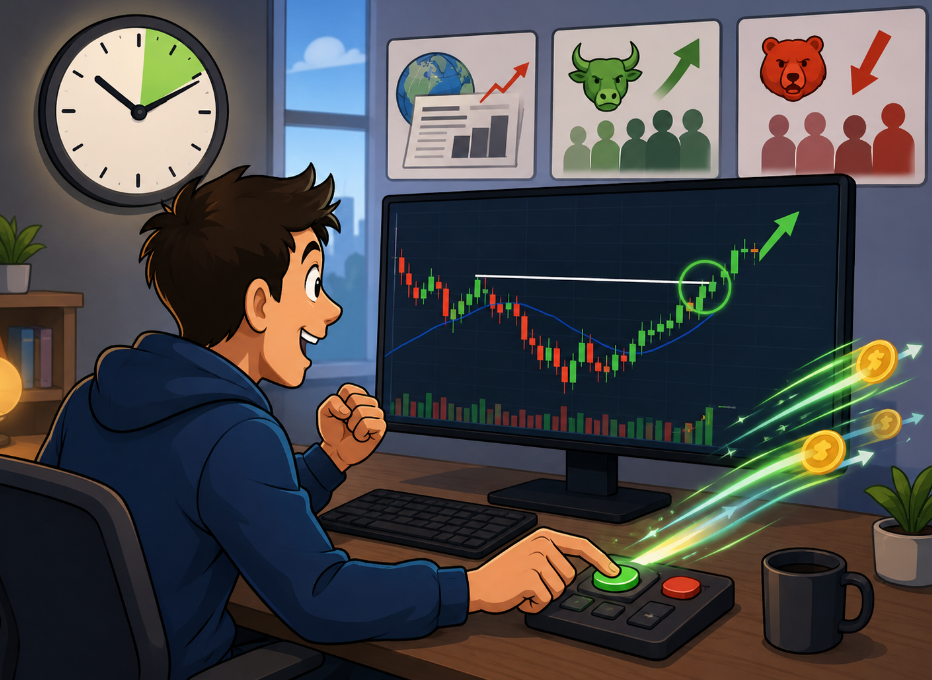
A late entry can turn a strong setup into a frustrating chase. Reading a trade chart at the right moment often comes down to timing, execution, and risk control working together. The ideas below connect chart analysis, macro drivers, sentiment, and order handling so a trade chart, trading chart, or chart trade setup can be acted on with better precision.
Timing with Quantitative Analysis and Economic Indicators
“Macro data surprises remain a primary driver of short-term FX volatility,” noted recent research commentary from major bank and exchange market outlooks published during 2025.
Combining Sentiment Analysis and Carry Trade Strategy
A trade chart gains context when Market sentiment supports direction. Check Sentiment indicators, News sentiment, and even Social media analysis. When Interest rate differentials favor a Carry trade, selected Currency pairs may show stronger follow-through. Fxbee users often combine these factors before acting on a chart trade signal.
Using Order Management Systems for Faster Execution
Stop-Loss Management Tailored to Scalping Strategies
Momentum Vs. Trend: Which Trade Chart Wins?
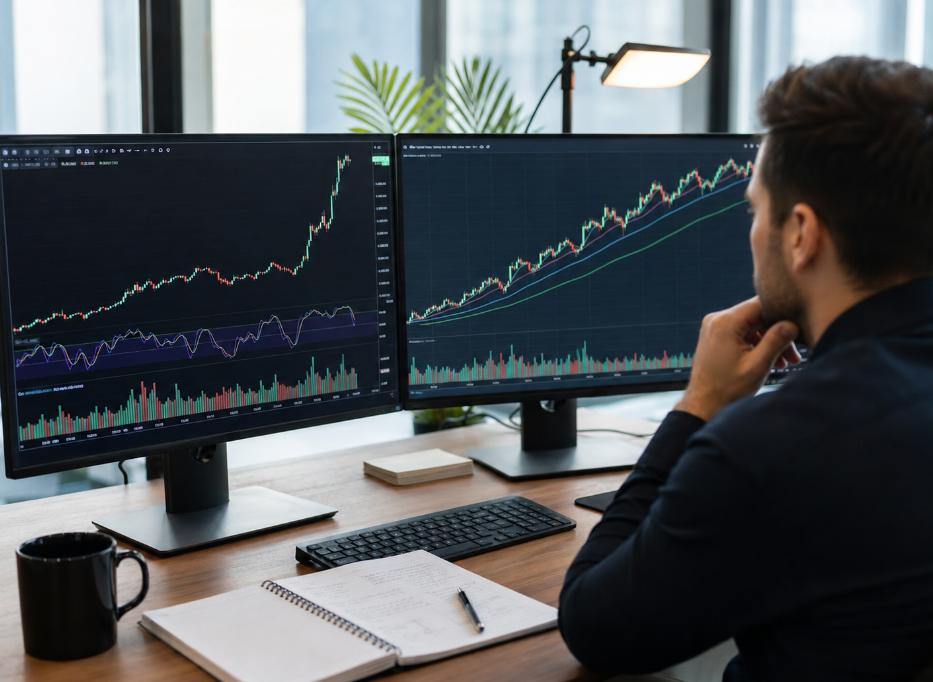
A trade chart can tell two very different stories. One focuses on speed and price thrust, while the other focuses on direction and staying power. In active markets, traders often compare a trade chart with a broader chart view before choosing an approach.
Momentum Indicators
When a trade chart starts moving fast, momentum tools help measure the strength behind that move.
Trend Indicators
A trend-focused trade chart aims to confirm direction rather than chase every swing.
Breakout Or Fakeout? Chart Patterns Explained
Reading a trade chart can feel a bit like watching a tug-of-war. A trade chart shows where buyers and sellers clash, while chart analysis helps spot potential turning points. On Fxbee, many traders compare each trade chart with volume and sentiment clues. A trade chart is useful, but context matters because not every move becomes a lasting trend.
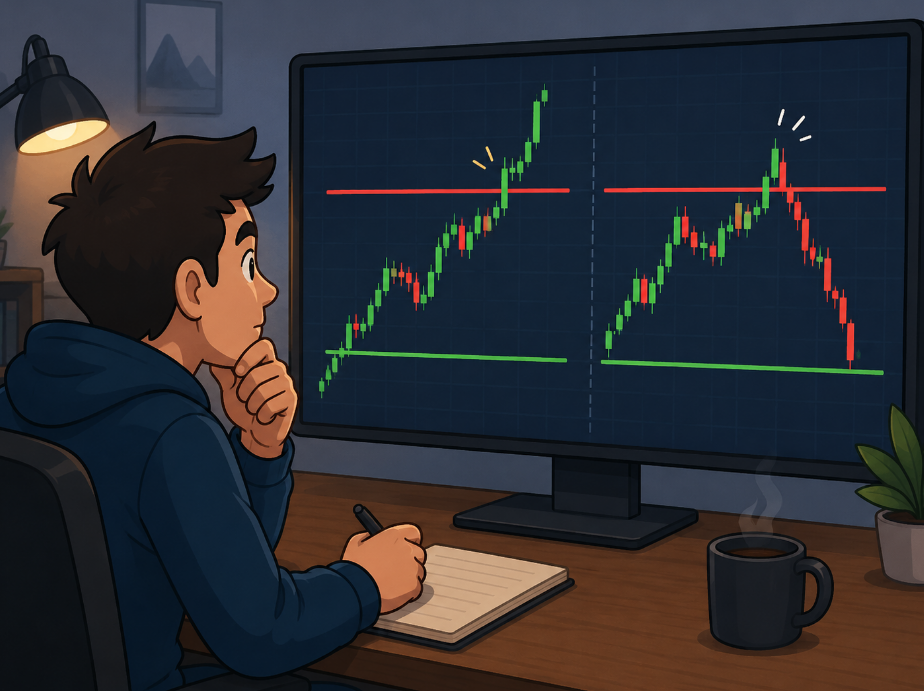
Breakouts
A breakout happens when Price movement pushes beyond a Resistance level or falls through a Support level with a clear Volume surge.
Fxbee users often compare multiple chart views because one trade chart alone may not tell the whole story.
Fakeouts
Not every breakout survives. Sometimes a trade chart flashes a False signal, then snaps back into the prior range.
When chart analysis suggests possible Market manipulation, patience helps. Waiting for confirmation across a trade chart, volume behavior, and sentiment often reduces the risk of chasing a fake move.
Balance Risk With ATR Insights
A smart risk process links volatility to exposure instead of relying on gut feeling. When reading a trade chart, traders can match position size, hedging choices, and stop placement to current conditions. A chart review paired with ATR readings often keeps decisions steadier. Fxbee highlights how a trade chart can support disciplined risk control.
Position Sizing Guided by ATR Levels
A trade chart showing expanding ranges usually calls for smaller allocations, helping preserve capital during faster market swings.
Hedging Strategies Coupled with ATR Volatility
When ATR rises, Hedging techniques can complement Volatility analysis rather than replace it. A trade chart may reveal pressure across correlated pairs, while Derivative instruments such as options or futures can support Risk reduction.
A trade chart and supporting market chart can help identify where protection may be most useful.
Stress Testing ATR-Based Stops under Margin Control
Repeated checks of the trade chart help ensure ATR-based stops remain practical under demanding market conditions.
References
FAQ
What are the seven crucial trade chart indicators traders should watch in 2026?
The article focuses on seven core tools: RSI, Fibonacci retracement, MACD, Bollinger Bands, Volume Profile, ATR, and algorithmic MACD. The goal is to simplify the trade chart instead of crowding it with too many signals.
Why should traders simplify their trade chart instead of using many indicators?
A crowded trade chart can make decisions slower and less clear. The article recommends focusing on a smaller group of widely used indicators so traders can compare price charts, market charts, momentum, volatility, and liquidity without creating indicator overload.
How should traders choose SMA and EMA settings?
Traders should focus on the relationship between settings, period, and timeframe rather than searching for one perfect number. Short-term traders may test 10–20 period values, while swing-focused traders may review 50–200 periods across different currency pairs.
How do moving average crossovers support spot forex entries?
A fast EMA crossing above a slower average may create an entry signal, while the opposite crossover may warn of weakness. The article stresses that crossovers should still be checked against currency pairs, trend confirmation, momentum, execution quality, and current market conditions.
How can traders avoid late entries when using trade chart signals?
The article connects late-entry risk with timing, economic data, quantitative analysis, sentiment, and order handling. Traders can reduce delays by using OMS/EMS, low-latency links, algorithmic trading tools, direct market access, and trade automation when a trade chart trigger appears.
What is the difference between momentum indicators and trend indicators?
Momentum indicators measure speed and price thrust, while trend indicators focus on direction and staying power. The article lists RSI, Stochastic Oscillator, MACD, Rate of Change, Commodity Channel Index, and Williams Percent R as momentum-related tools, while moving averages, trendlines, ADX, Parabolic SAR, Ichimoku Cloud, Bollinger Bands, and Keltner Channels help assess trend structure.
How can traders tell the difference between a breakout and a fakeout?
A breakout occurs when price moves beyond resistance or support with clear volume participation and confirmation. A fakeout may show a false signal, quick price reversal, retest failure, stop-loss hunting, a bull trap, or a bear trap. The article recommends checking the trade chart together with volume behavior and sentiment before chasing the move.
How does ATR help traders manage risk on a trade chart?
ATR helps connect volatility with position sizing, stop-loss placement, hedging, and stress testing. When ranges expand, traders may reduce trade allocation, review account leverage, estimate margin call and liquidation risk, and validate ATR-based stops through stress testing and backtesting scenarios.