
A trade chart can make a decision look simple: a line breaks, a candle closes, and an entry seems obvious. The expensive part often comes earlier—using the wrong context, treating an estimate as certainty, or taking a position before the risk is defined. This guide explains five recurring chart-reading mistakes and a practical routine for avoiding them. It is educational material, not investment advice, and it does not suggest that any chart pattern can predict a result.
For U.S. readers in particular, forex deserves a careful approach. The CFTC warns that leverage can amplify losses, dealer terms matter, and registration should be verified before funding an account. A better chart process cannot remove those risks; it can only make the decision process more deliberate.

At a glance: the five chart mistakes
| Mistake | What goes wrong | A more useful habit |
|---|---|---|
| 1. Reading one time frame in isolation | Short-term noise is mistaken for the broader move. | Start with a higher-time-frame map, then use the execution chart. |
| 2. Treating levels as exact prices | A normal test of a zone is misread as a clean break or failure. | Mark areas and define what confirmation would look like. |
| 3. Ignoring costs and conditions | The chart idea omits spread, commission, liquidity, and event risk. | Check the executable price and the calendar before entering. |
| 4. Entering before defining invalidation | Position size becomes an afterthought and a small error grows. | Set the invalidation point and acceptable loss before the order. |
| 5. Letting the last outcome rewrite the chart | Revenge trades and confirmation bias replace a repeatable plan. | Use a written checklist and review trades after, not during, the impulse. |
1. Using a trade chart without higher-time-frame context
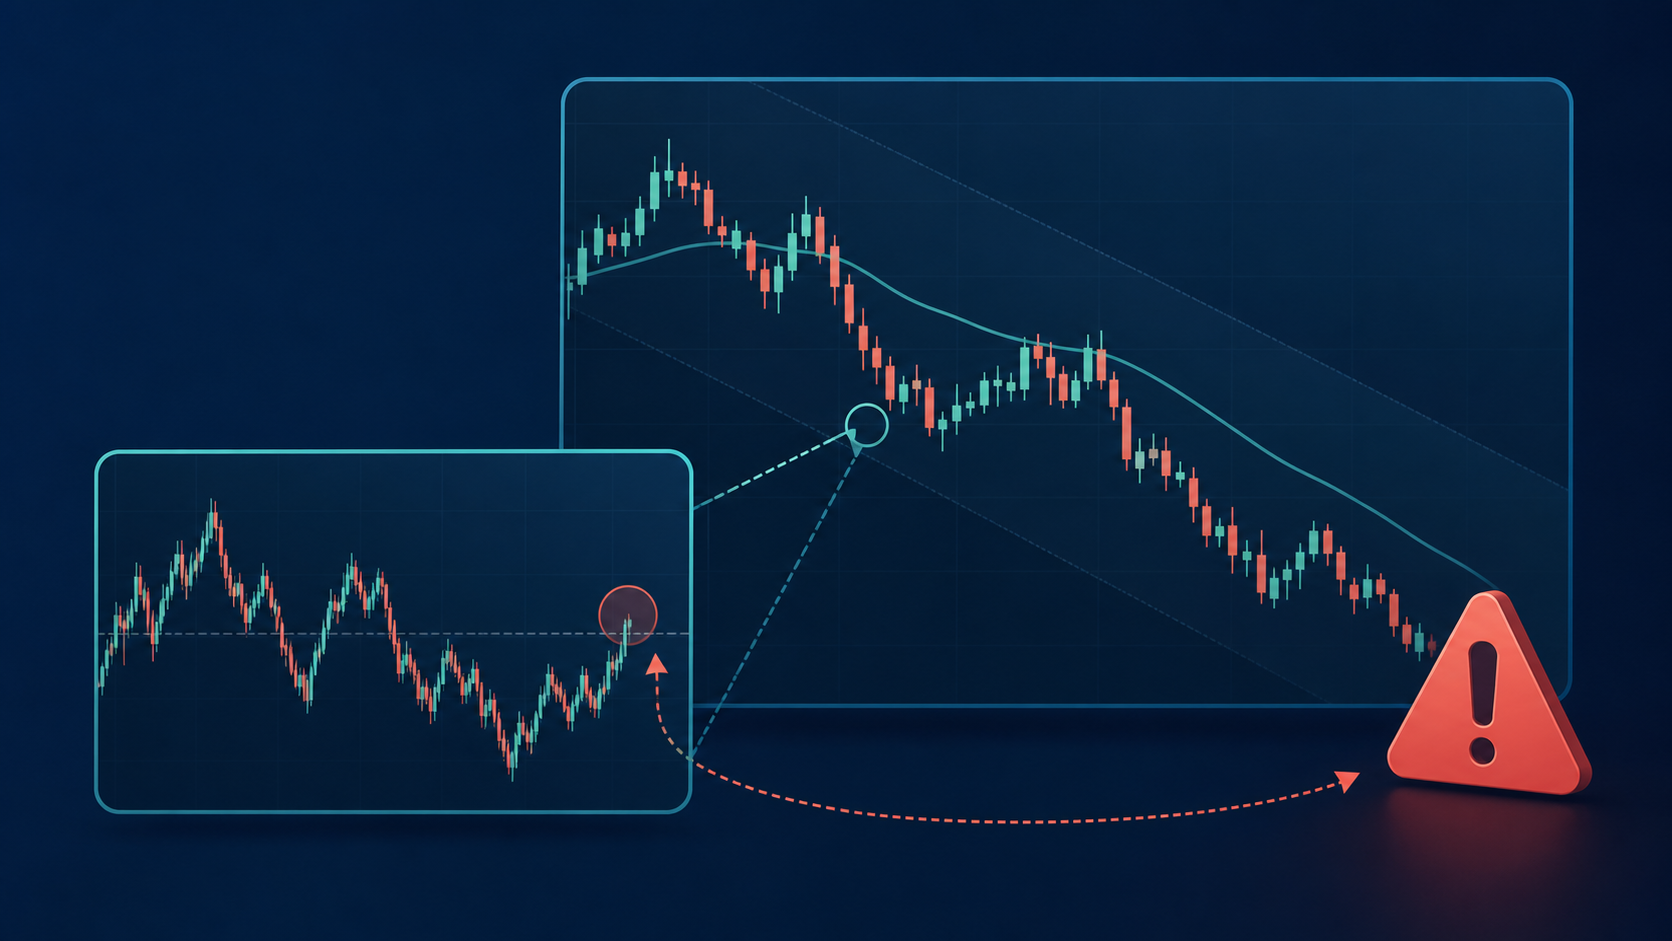
A five-minute chart can show an attractive breakout while a four-hour chart is still moving into a long-established resistance area. Neither view is automatically “right”; they answer different questions. The higher time frame helps frame the environment—trend, range, recent volatility, and nearby decision zones. The lower time frame can then be used to plan entry and invalidation.
The mistake is not using a short chart. It is allowing its detail to crowd out the bigger map. A fast sequence of candles feels informative because it changes constantly, yet it may be little more than noise inside a wider range. Before focusing on a trigger, note the pair, the higher-time-frame swing structure, the nearest relevant zone, and whether the proposed trade is with or against that context.
A simple top-down routine
-
Use a higher time frame to mark trend, range boundaries, and event-driven extremes.
-
Move down only after you know where the idea sits on that map.
-
Write one sentence describing why the lower-time-frame signal is meaningful in that context.
-
If you cannot write that sentence, treat the setup as incomplete rather than forcing an entry.
2. Drawing support and resistance as rigid lines
Charts invite false precision. A horizontal line is easy to draw, but markets rarely turn at one identical price each time. Spread, liquidity, volatility, different data feeds, and the way participants place orders can produce small overshoots or shallow failures. A line may be useful as a reference; a zone is often more honest about uncertainty.
Instead of asking, “Did price touch my exact level?” ask what behavior would make the area relevant. That might be a rejection, acceptance and retest, a change in swing structure, or simply a close beyond the zone on the time frame you chose. The definition should be written before the moment of pressure.
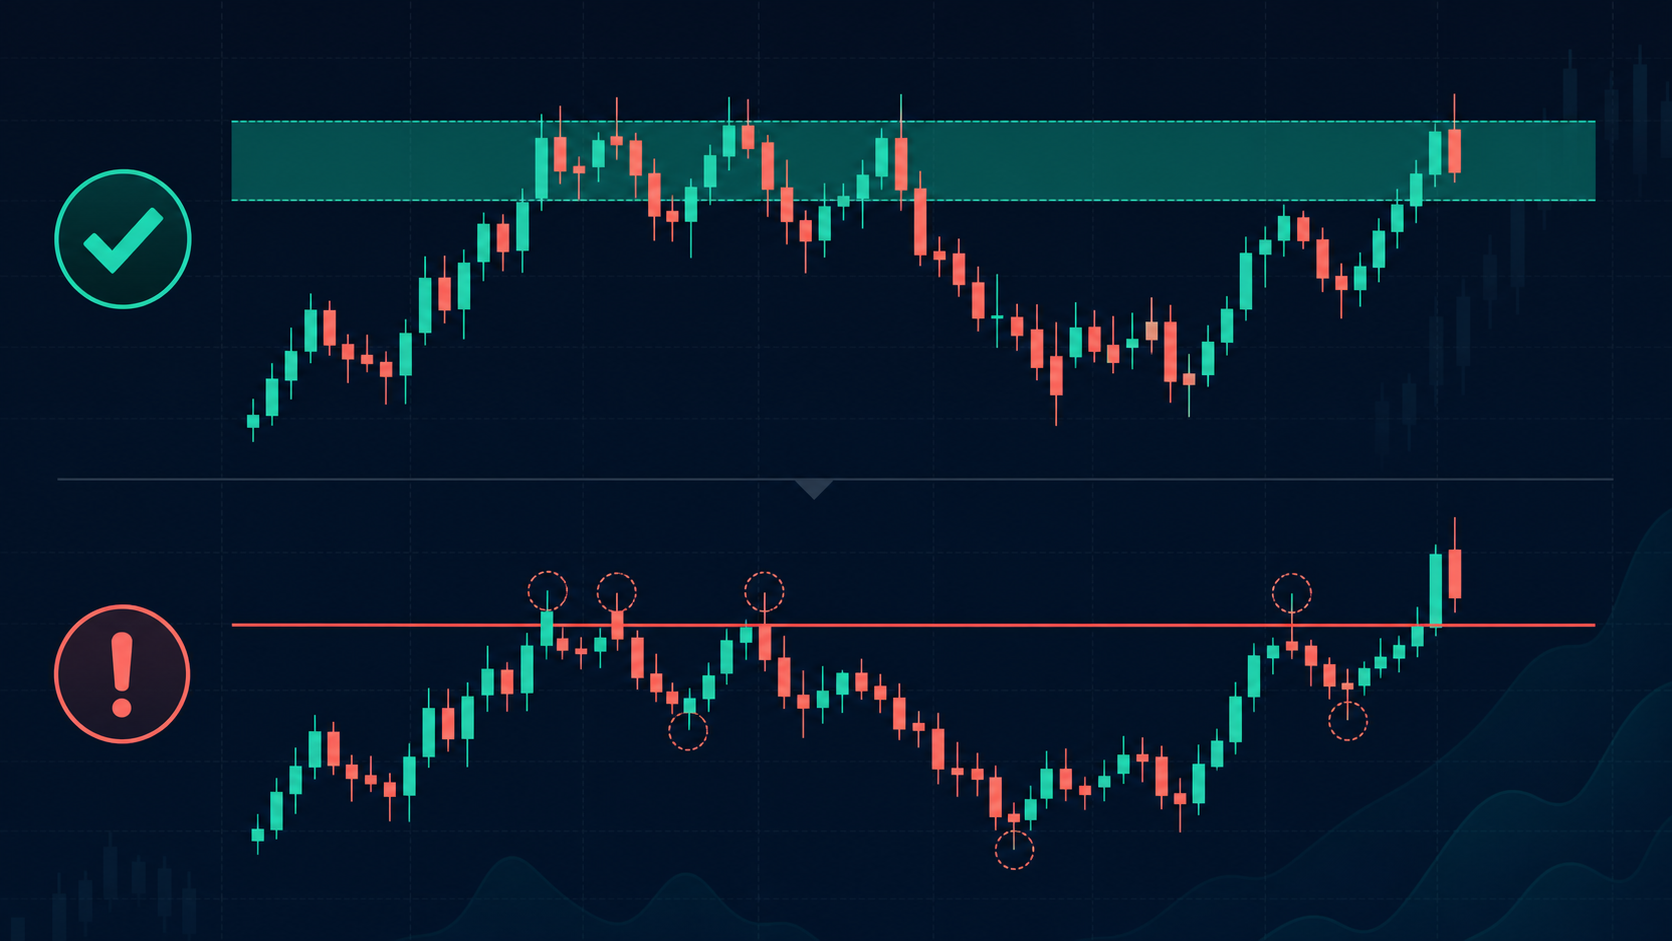
This adjustment is especially useful around scheduled data releases, market opens, and thin-liquidity periods, when a brief move beyond a line may not carry the meaning a static drawing suggests. It also discourages placing a stop at an obvious single price merely because it looks tidy on a chart.
3. Letting the picture hide trading costs and market conditions
A chart pattern is not an executable trade until costs and conditions are included. Bid-ask spread, commission, financing, slippage, and the distance to a protective stop can change the practical risk of a short-term idea. The SEC’s Investor.gov guidance notes that transaction costs can turn otherwise profitable forex trades into losing transactions and that dealer pricing deserves careful review.
Before an entry, check the current spread and your expected trade frequency. Then check whether major economic data, a central-bank decision, or a market close is close enough to make a normal chart setup behave unusually. This does not require forecasting news; it means acknowledging that the chart may not show the full risk picture.
For readers comparing providers, FXBEE’s broker comparison page is one place to review listed rebate and account information. Treat any comparison as a starting point, not a substitute for reading the broker’s current disclosures, account agreement, fees, U.S. eligibility, and registration status. FXBEE states that it is a third-party platform and does not provide trade execution or investment advice on its support page.
4. Entering before your invalidation and position risk are defined
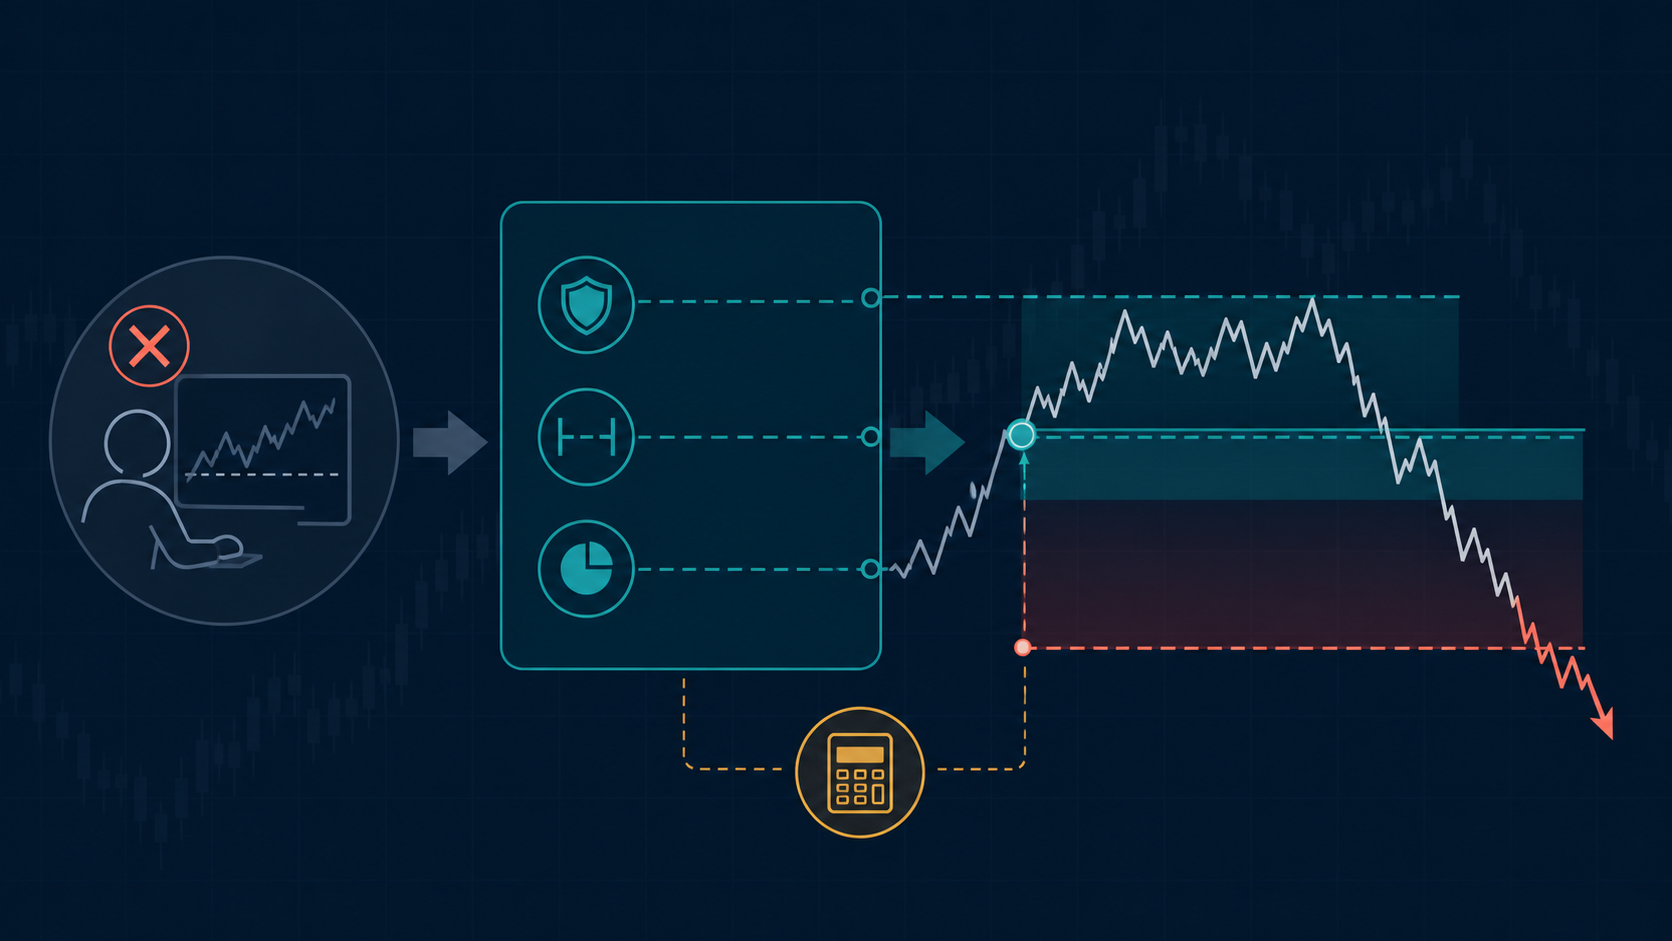
A common sequence is: spot a pattern, enter quickly, then hunt for a stop that feels tolerable. That reverses the decision order. First decide what market behavior would show that the idea is no longer valid. Then measure the distance from entry to that point. Only then can position size be considered against an amount of capital you have decided you can afford to lose.
Leverage makes this order important. In retail off-exchange forex, a relatively small deposit can control a much larger position; the CFTC explains that adverse moves can require additional funds or a closed position, and losses may exceed the initial deposit depending on the arrangement. See its forex risk advisory for the broader warning.
Questions to answer before placing an order
-
What observation would invalidate the chart idea?
-
At what executable price—not just a midpoint—would that be recognized?
-
How much of the account is at risk if the invalidation point is reached?
-
Could spread widening or scheduled volatility make the intended stop impractical?
-
Does the trade still make sense after all expected costs?
5. Re-reading the chart to justify the last outcome
After a loss, the next chart can feel like a chance to get even. After a win, a weaker signal can appear stronger than it is. Both reactions turn the chart into a story that supports a recent emotion rather than a decision tool. The practical defense is boring but effective: use the same pre-trade criteria every time and leave a short record of the setup, risk, and reason for exit.
A trade journal does not need to predict future prices. It should help you notice whether you are taking the same kind of setup, whether costs were included, whether a stop was moved, and whether you traded during conditions your plan said to avoid. Review the record after the session, when there is less pressure to rationalize a decision.

A one-minute trade chart checklist
-
Context: What does the higher time frame say about trend, range, and nearby zones?
-
Setup: What specific behavior is the entry responding to?
-
Invalidation: What would prove the premise wrong?
-
Risk: Is the potential loss, including realistic execution costs, acceptable?
-
Conditions: Are high-impact events, liquidity changes, or spread conditions likely to distort the setup?
-
Provider check: For U.S. retail forex, verify the firm and relevant people through the appropriate regulator and read the risk disclosure. The CFTC recommends checking registration and disciplinary history before making a deposit.
If a checklist item cannot be answered, waiting is a valid decision. A missed setup is not evidence that the next setup must be taken.
Where FXBEE fits—and where it does not
FXBEE publicly presents broker comparisons, rebate information, copy-trading insights, and support resources. Its Terms of Use say that support information is for general informational and educational purposes and is not investment, legal, or financial advice. Use that boundary when reviewing any chart, provider information, or third-party strategy data.
Before using any broker or platform, review the provider’s own current fees, product availability, legal disclosures, and account protections. Country restrictions, offerings, and terms can change. For U.S. users, confirm that a firm is permitted to serve you rather than inferring eligibility from a global website or a charting feature.
Bottom line
The goal of a trade chart is not to create certainty. It is to make uncertainty visible enough to manage. Map the broader context, use zones rather than magical exact levels, include costs and conditions, define risk before entry, and make the checklist stronger than the last emotional outcome. Those habits will not guarantee a profit, but they can help you avoid turning a chart observation into an unmanaged exposure.
FAQ
What is a trade chart?
A trade chart is a visual record of price movement over a chosen period. Traders may add volume, indicators, trend lines, or zones, but the chart itself is not a forecast or a recommendation. Its usefulness depends on the market, time frame, data quality, costs, and the risk process around a decision.
Which time frame should I use for forex charts?
There is no universal best time frame. Use a higher one to understand the environment and a lower one only if it fits your planning horizon. A person holding a trade for days may need a different chart hierarchy than someone evaluating a short intraday move. Consistency matters more than searching for a perfect setting.
Are support and resistance exact prices?
Usually, they are better treated as areas of interest than exact prices. Different feeds, spreads, volatility, and order flow can produce small overshoots. Define in advance what confirmation or invalidation you need around an area instead of relying on a single line alone.
Why can a chart setup lose even when the direction looks right?
Entry timing, spread, commission, slippage, financing, stop placement, and position size all affect an outcome. A directional view can be correct while the actual trade is poorly timed or too expensive. This is why a chart observation should be evaluated alongside executable prices and risk.
Should I trade before major economic releases?
That depends on your documented strategy and tolerance for rapid price movement, wider spreads, and slippage. If you have not planned for those conditions, waiting until the market behavior is clearer may be more appropriate than treating the chart as normal.
What should I define before placing a forex trade?
Write the market context, the entry condition, the point that invalidates the idea, the potential loss at that point, and the costs or events that could affect execution. If any of these are unclear, the setup is not yet fully specified.
Can leverage make a small chart error expensive?
Yes. Leverage can magnify gains and losses because a smaller deposit supports a larger position. Depending on the arrangement, losses can be substantial and may exceed the initial amount deposited. Read the provider’s risk disclosure and consider whether leveraged trading is appropriate for your circumstances.
How do I verify a forex provider in the United States?
Check the firm and relevant individuals with the appropriate U.S. regulator and review the firm’s disclosures, fees, and eligibility rules. The CFTC directs readers to check registration and disciplinary history through NFA resources. Registration is an important check, not a guarantee against loss or misconduct.
Do rebates remove trading costs or risk?
No. A rebate arrangement may affect the net cost structure, but it does not remove spread, commission, financing, execution, leverage, or market risk. Review the current terms of the provider and broker, and calculate a trade using realistic assumptions before relying on a rebate.
Does FXBEE provide investment advice or trade execution?
FXBEE states on its support page that it is a third-party platform and does not provide trade execution or investment advice. Review its current support information and terms, as well as the separate disclosures of any broker or other third party you consider using.
Risk notice: Forex and contracts for difference can involve substantial risk, including possible loss of the entire amount invested and, depending on the arrangement, more. This article is general education for U.S. readers, not individualized investment, legal, tax, or financial advice.